


Hello,
I am new to DSP processing and am using an implementation of the Yates and Lyons DC blocking algorithm, drawn from the GNU Radio DC Blocker plugin in order to remove the DC component of a complex IQ stream from an SDR. When I plot the FFT results, I see extremely negative values around the zero bin instead of a "flat slope" that the use of the plugin in GRC and other DC blockers produce. Below is the processing order I use. I have tried changing when I apply the DC blocker, but that doesn't make any difference. I suspect there is some simple error in my processing, but I have spent an inordinate amount of time troubleshooting and cannot understand how the extreme negative values around the zeroeth bin/center frequency occur.
1. Apply dc blocker to raw I+Q
2. Apply a windowing function
3. DFT/FFT process
4. For each bin, calculate an average amplitude over N blocks of samples
5. Display 20*log10(avg_amplitude) values in frequency domain
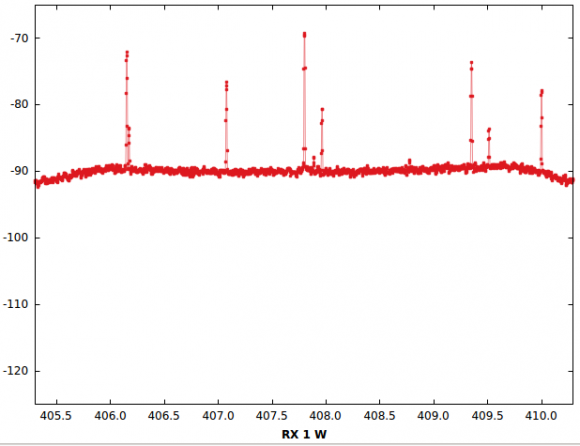
I have attached graphs for when I apply and the blocker and when I don't. Varying the bins / size of the sample stream doesn't significantly change. I have also tried changing the input parameters to the blocker (long form vs short form, D values from 4-64) without obtaining the desired result. The graphs show 2048 FFT bins ad the use of an HFT70 window and 72.2% overlap. I see the trough/large negative spectral response behavior without any windowing.
Thank you for any advice.

Tony

I developed the "moving average" DC blocking filter based on real-valued (binary two's complement) input signals. But off the top of my head I see no reason why the filter shouldn't work properly with quadrature (I/Q) input signals.
Concerning your five steps, here are a few humble comments for you to consider:
Step# 1: You're not applying a DC blocking filter to your input signal, you're applying your input signal to your DC blocking filter.
Step# 2: Is it really necessary to apply a window function to your filtered signal? Whether or not to "window" a time-domain signal depends on exactly what follow-on processing you intend to perform on the filter's output signal. In many DSP applications windowing of time-domain signals is not appropriate.
Step# 4 & 5: If what you call an FFT sample's "amplitude" is actually the magnitude of a complex number, then to be correct and to avoid confusion, you should replace your word "amplitude" with the word "magnitude." Remember, in signal processing "amplitudes" can be either positive or negative values. "Magnitude" values are strictly positive only.
One thing that causes confusion for us is that your two spectral plots are NOT the result of your above listed Step# 3 thru 5. The frequency axes of your plots make no sense at all from the standpoint of standard DFT/FFT processing. Some kind of mysterious frequency translation and spectral "zooming in" are taking place in your processing, that you failed to describe to us, to generate the spectra shown in your two plots.
OK, I think Bryant and johndyson10 have answered the crux of your question. The DC blocking filter's function is to attenuate (reduce) spectral energy in the neighborhood of zero Hz (DC) while maintaining linear phase at all other frequencies. And when you plot a spectrum with a logarithmic vertical axis you are actually plotting the log of the ratio of a spectral sample's power at a given frequency divided by some "reference power value." So if that ratio is a very small number (<< 1) the plotted log value will be a large negative number.
For example if the ratio of the two power values is 0.000316 then the plotted logarithmic spectral value will be roughly -70 dB. That "-70 dB" value does NOT mean that some measured power is negative, it means that some power ratio is very small relative to unity(one).
As Bryant and johndyson10 imply, I think your DC blocking filter implementation is working just as it should.
By the way, if you overall processing goal is to estimate (measure) spectral power, or to detect the presence of spectral energy, perhaps you don't need the DC blocking filter at all. In that case you could compute some spectrum and merely zero-out (or ignore) the DFT/FFT's first output (DC) sample. However, if your application involves demodulating some sort of digital communications signal then you may well need a DC blocking filter.
Tony, if you have more questions don't hesitate to ask.
Rick - Thank you for the thoughtful reply. It is because of your interactions on DSPRelated and reputation that I bought your book some time ago.
Some comments, answers, and questions--
Step #1 The distinction you make regarding what is applied to what surely has more than minor semantic intent. What is the implication of applying a signal to a filter and not vice versa?
Step #2 Window use is arbitrary at this point, but sets the stage for some radio astronomy applications where determination of amplitude/magnitude/level to others' measurements where calibrated, absolute (non-relative) values are available, is a goal.
Steps #4&5 I think with beginners, there is a tendency to use terminology in a less disciplined way than experts. In the FFT paper I reference, which profiles the behavior of various windows and identifies "new" flat top windows, they consistently refer to amplitude and not magnitude. Hence my bias to using amplitude, when you point out that magnitude is what I am using (though expressing it using a logarithmic scale).
The mysterious process I use to translate frequency for graphing purposes is where I suspect my problem is what the trough effect. I associate the center frequency with (FFT size/2) + 1 bin. Then the zeroth bin returned from the FFT output (fftw3) is labelled with Center Frequency - (effective sampling rate/2). I do this because of use of complex numbers and my understanding of that mapping.
So to your final comment:
if you overall processing goal is to estimate (measure) spectral power, or to detect the presence of spectral energy, perhaps you don't need the DC blocking filter at all. In that case you could compute some spectrum and merely zero-out (or ignore) the DFT/FFT's first output (DC) sample.
I am trying maintain an "average" across the bins which span the center frequency. So if eliminate the bin which represents the center frequency , if I have this correct, I still have the problem that there are non-average values in a few adjacent bins (spectral leakage from the FFT?). That's why I thought using a DC blocker would be good, but then I am left graph #2. So still remain puzzled.
Tony
Regarding the use of the words "amplitude" or "magnitude", what I wrote was correct. The vertical axis label of Figure 3 in the "Spectrum and spectral density" paper by G. Heinzel, et al, is incorrect. That vertical axis should be "Magnitude (dB)".
When you use the phrase "center frequency" I don't understand what you mean. Regarding the labeling of the frequency axes in spectral plots, did you understand the discussion in my book's Section 3.5? For traditional FFTs the first FFT sample, associated with frequency axis index m = 0, corresponds to the frequency of zero Hz (DC).
Sometimes people take the second half of their FFT magnitude samples and plot them to the left of the original first half of the FFT magnitude samples. (They are able to do this because the send half of the original FFT's samples can be interpreted as negative frequency.) This rearranges the frequency axis labeling so that zero Hz is now roughly in the center of a spectral plot. [I chose to do that in my book's Figure 3-13(a).] Did that "first half and second half swapping" take place for your spectral plots?
Tony, sorry but I did not understand your phrase "maintain an "average" across the bins" in your reply's last paragraph. Not knowing exactly what DSP operations you're performing, I'll stick my neck out and recommend that you pass your very original input sequences through the DC Blocking filter and then proceed with whatever follow-on processing your desire.
[-Rick-]
PS. Tony, did you see the blog at:
Rick,
Thank you for the pointer to the errata.
The "first half and second half swapping" is exactly what I'm doing.
The center frequency is the tuned center frequency for the SDR providing the quadrature stream.
To try to be more clear, I am desiring and expecting the noise floor average before and after the center frequency to replace the DC peak when I use a DC removal/blocker algorithm such as yours and what is implemented in GNU Radio.
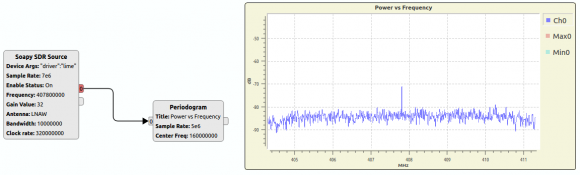
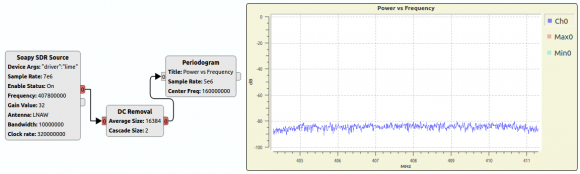
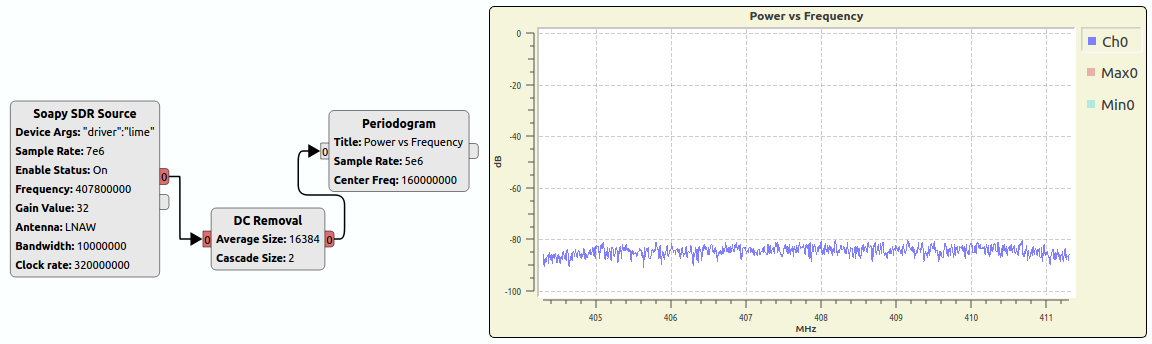
As a concrete example, please see the two screenshots from PothosFlow (A GUI Front end and topology editor similar to GNU Radio Companion). In one screen shot, you see the streaming going directly from the SDR to a periodogram. In the second, a DC Removal block is in the pathway, resulting in the Periodogram showing the DC component being smoothed/average, but NOT taken to near zero / near -inf as in the first screenshots from my own software. Even after inspecting that filter's code, which implements your algorithm, I cannot yet determine why the different results using the same general approach.
Best,
Tony
Hello Tony.
Looking at the second image of your 8/19/2018 post, it looks to me like the DC blocking filter has reduced that spectral spike at zero Hz (DC) of the first image down to the average "background" noise level. And that is what I expect.
Tony, is the second image the spectral magnitude of the output of the DC blocking filter, or is it the spectrum of some other node (some over point) in your processing system?
Rick - Yes, the boxes/nodes you see are all the processing that is going on once the raw I/Q samples reach the computer. The nodes are 1) raw streaming source to obtain the samples, 2) dc blocking filter (not used in the first topology and 3) the periodogram. There is no other processing. I will have to look and see what the periodogram code is doing as dc removal filter code isn't doing anything different than what my code does. It's still a mystery...
Tony

Tony-
Great thread with lots of detailed, helpful discussion but seems it's still not completely resolved from your perspective. I was going back to your original post, where you mentioned "When I plot the FFT results, I see extremely negative values around the
zero bin instead of a "flat slope" that the use of the plugin in GRC and
other DC blockers produce."
Could you post an image of exactly what you're expecting ? In particular flat slope ... what does that look like, a notch ? A wide V or U shape ? Maybe that would be a clue as to why you're still worried about a "trough effect" in your frequency domain plots.
-Jeff
Jeff - Thank you for the note. In my just posted reply to Rick, I decided to post a screenshot of desired behavior from an existing implmentation tool that uses the Yates and Lyons algorithm. I hope that posting at least clarifies the question. In my original posting, you see what I obtain using that algorithm. I have tried variations without Windowing and averaging that would be equivalent to the PothosFlow examples, but to no avail.
Tony
Tony,
Some clarification would help me.
First - you say 'zero bin', but your X labels on the graphs show 405.5 to 410.0. ???
Second - can you give the filter that you are using for the DC blocker, described as an FIR or IIR?
Thanks,
Bryant
Bryant -
The zero bin region is 407.8 MHz, the center frequency to which the SDR is tuned, and the center of the graph. N = bins, and N/2 is the zero bin after FFT with complex IQ values.
The filter algorithm is described here:
https://www.dsprelated.com/showarticle/58.php
Tony
So, if 407.8 MHz is the 'zero bin', and you have a large negative value in dB at that point - isn't this what you want? You are putting a notch at that frequency and killing it.
What am I missing?
I am going to clarify what the OP responded (hope I am not stepping on anyone.) When you have a large negative dB, that is essentially zero.
dB scale can be confusing, thinking that a large negative dB is a large negative value, which it isnt -- dB cannot even distinguish between 'negative' DC values and 'positive' DC values.
Since the IQ samples are complex, the zero bin is N/2+1 or the center frequency of 407.8 MHz. But you also see is significant negative db values in adjacent bins (which John Dyson points out are near zero prior to the conversion to dB, and that is not desired. What I am seeking is an average value across those bins rather than the spike you see in the first graph and the trough in the second. The average or flatness is what one obtains from using dc blockers in GNU Radio with the DC blocker. I am on to reading Rick Lyons' reply next.

Do you mean you apply dc blocker before downconverting centre frequency to zero?
fred

The y axe is in logarithm scale. A logarithm function returns a negative value for a lower than 1 input. If you compute the logarithm of a negative number you will get a complex value as result.


