


Why am I getting the same frequency response plots when one has aliasing and the other does not?
 Started by 6 years ago●9 replies●latest reply 6 years ago●239 views
When given
x[n] = cos[2*pi*f*n]
n = 0: T :10
T = 1/fs
for fs = 10Hz
I get the same frequency response figures.
for f = 3Hz, f = 7Hz, and f = 13Hz.
so that means that aliasing occurs for when the sinusoid frequencies 13Hz and 7Hz, but not for 3Hz.
Could someone explain why and what is the relationship that I am not seeing?
Here is a picture, the one on the left is whenever I use f = 3Hz, f = 7Hz, and f = 13Hz
the one on the right is when I used f = 4Hz.
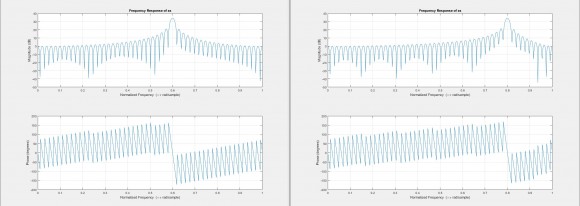
the peak moves around depending on the f, but for f = 3Hz, 7Hz, 13Hz, 17Hz, 23Hz,... the peak is always located at the same Normalized Frequency

If your sampling frequency is 10 Hz, then all input frequencies from 0 to 5 Hz will show up properly. As you advance the input frequency from 5 toward 10, the aliased frequency moves from 5 toward 0. Therefore an input frequency of 7 shows up as 5 - (7-5) = 3. As you advance the input frequency from 10 toward 15, the aliased frequency moves from 0 toward 5. Therefore an input frequency of 13 shows up as 13-10 = 3. As you advance from 15 toward 20, the aliased frequency moves from 5 back to 0. The pattern repeats.
Aliasing occurs when there is a frequency component higher than Fs/2. Why are you surprised that you get aliasing?
To give you a geometric way of viewing this... In the Z-plane, all purely-real sinusoids are represented by a complex-conjugate pair of poles on the unit circle. As you move from 0 degrees (or radians) to 180 degrees (or pi radians), you are representing a sinusoid advancing in frequency from 0 to the Nyquist frequency, which is half your sampling rate, which in your case is 5 Hz. As you advance the angle in the unit circle past 180 degrees, which is effetively your advancing your input frequency from 5 to 10 Hz, your operating point in the unit circle is moving into the 3rd and then 4th quadrants. However, the *conjugate-pole pair* are exactly those of a sinusoid changing in frequency from 5 down to 0. As you go past 10 Hz, which on the unit circle means going back around teh unit circle from the 4th quadrant to the 1st and then the second, the *conjugate-pole pair* are exactly those of a sinusoid changing in frequency from 0 up to 5. the pattern repeats as you keep advancing the input frequency, which means keep moving counter-clockwise around the unit circle.

Away from dsp principles, Matlab does not have time dimension but just streams of samples.
if you look at value of x for 3,7,13MHz you will see exactly same data.

Everything is correct. As achesir and pomartel have described, aliasing is occurring for frequencies larger than the Nyquist frequency. In your example the sample frequency is 10 Hz, so the Nyquist frequency is 5 Hz. At a sample frequency of 10 Hz, 5 Hz is the largest sinusoid frequency that can be correctly represented.
With respect to your plots, the frequency for the 3 Hz sinusoid (and the aliased sinusoid frequencies of 7 Hz, 13 Hz, etc.), shown in the left plot, is 0.6 times the sample frequency of 5 Hz: 0.6 X 5 Hz -> 3 Hz. The frequency for the 4 Hz sinusoid, shown in the right plot, is 0.8 times the sample frequency of 5 Hz: 0.8 X 5 Hz -> 4 Hz. 4 Hz is less than the Nyquist frequency of 5 Hz, so this plot is correct.
achesir's description is clear and succinct. If you're looking for a reference on aliasing and other digital signal processing concepts see Introduction to Signal Processing.
I am afraid I do not see any reason to go to dsp principles and aliasing in this example. The above matlab code generates same and exactly same three sets of data. So I think we should get same frequency response. All aliasing principles just play no rule whatsoever in this case.
It is only valid to say that all these frequencies will have same samples if sampled at an ADC

"It is only valid to say that all these frequencies will have same samples if sampled at an ADC" is conditionally right, but only if the the signal is within the ADC's input sample-and-hold bandwidth. A sample-and-hold's bandwidth still has to comply with the Nyquist limit, and if it doesn't, things can get really messy (i.e. nonlinear), ignoring other issues like sample jitter that can smear a signal. Sampling bandwidth is not an issue in Matlab, since synthetic samples have "infinite bandwidth" (Dirac impulse sampling), and perfect aliasing.
Yes that is true. I should have said that:
"It is only valid to say that this matlab exercise indicates that -ideally- all these frequencies will have same samples if sampled at same phase by an ideal ADC."
Practically, ADC and DAC behave as sinx/x filter due to their finite sample and hold.
Matlab has no time dimension. We can only have samples and a fictitious vector that may be called time(T). Matlab fft only shows the normalised or scaled digital range of +/- Nyquist because that is what we get in a digital domain.
sounds like aliasing to me. What did you expect to see


