Octave BandPass Filter on Audio Wav Files
I need to somehow do an octave bandpass filter on some audio wav files. The reason for doing this is afterwards I need to get the envelope of the bands and do some analysis on it. Problem is, I have no idea what I'm doing. Doing my best to follow a white paper to accomplish speech rate detection.
I found many libraries that will do an octave filter, problem is, the api always requires certain input parameters that I have no idea how to obtain and searching doesn't help. Those inputs are
- start band
- end band
- center frequencies
- The distance between the center frequencies
- band edges
I don't know what any of those parameters are and I don't know how to find the info on them online, I've tried. I need some directions on how to get from
Audio -> Octave BandPass Filter
or
Audio -> (center frequencies, band start/end etc etc) -> Octave BandPass Filter

Resaech EMS methods. I found this readily IS2018Supp.pdf
Given the link to the Python library, you need Python code?
Thank you for that link it helped a little. If there is code already to do this exactly then, yes that would be what I would need. It appears I need 9 octave bands with center frequencies at "30, 60, 120, 240, 480, 960, 1920, 3840, and 7680". This is a big help. But that paper raised even more questions.
It claims the filtered octave signals is given by:
xi[n] = hi[n] ∗ x[n], i = 1, . . . , 9
Where hi[n] is a lowpass butterworth filter. Scipy has such a filter. scipy.signal.butter. But it needs input parameters that are even more confusing.
- The order of the filter.
- A scalar or length-2 sequence giving the critical frequencies. For a Butterworth filter, this is the point at which the gain drops to 1/sqrt(2) that of the passband (the “-3 dB point”). For digital filters, Wn is normalized from 0 to 1, where 1 is the Nyquist frequency, pi radians/sample. (Wn is thus in half-cycles / sample.) For analog filters, Wn is an angular frequency (e.g. rad/s).
- The type of filter. Default is ‘lowpass’ - I assume based on the paper I need a lowpass.
- analog - true or false
- Type of output: numerator/denominator (‘ba’) or pole-zero (‘zpk’). Default is ‘ba’.
- Numerator (b) and denominator (a) polynomials of the IIR filter. Only returned if output='ba'.
- Zeros, poles, and system gain of the IIR filter transfer function. Only returned if output='zpk'.
So now I'm even more confused than I originally was. The funny thing is, this is probably stupidly simple for me to code up. I bet this is nothing more than a bunch of multiplications and divisions over a time domain. But hell if I can penetrate all this advanced DSP jargon.
Any help in demystifying this supposed straight forward, one page described, EMS filter would be really really appreciated.
Hi,
You have a long road ahead of you if you are attempting to implement the recurrent neural network (RNN) in the white-paper you cited in your original post. Regardless, let me see if I can provide you with some guidance on the octave filtering used for the Envelope Modulation Spectrum (EMS) feature extraction aspect of that paper.
As you noted, the octave-band signals are generated by convolving the impulse response of an octave filter (i.e. hi[n]) with the speech signal (i.e. x[n]). The impulse response function for each octave-band filter can be generated using the SCIPY.SIGNAL.BUTTER function and used to filter the speech signal using the SCIPY.SIGNAL.FILTFILT function.
As an example, let's consider an octave band filter with a center frequency of 480 Hz. The associated octave-band cut-off frequencies are approximately 339 Hz and 678 Hz (678 Hz is twice as large as 339 Hz; i.e. a doubling in frequency). The respective impulse response for this octave filter is generated using the following Python code,
from scipy import signal
import numpy as np
import matplotlib.pyplot as plt
import math

sampleRate=16000.0; nyquistRate=sampleRate/2.0

centerFrequency_Hz=480.0;
lowerCutoffFrequency_Hz=centerFrequency_Hz/math.sqrt(2);
upperCutoffFrequenc_Hz=centerFrequency_Hz*math.sqrt(2);

% Determine numerator (b) and denominator (a) coefficients of the digital
% Infinite Impulse Response (IIR) filter.
b, a = signal.butter( N=4, Wn=np.array([ lowerCutoffFrequency_Hz, upperCutoffFrequenc_Hz])/nyquistRate, btype='bandpass', analog=False, output='ba');

% Compute frequency response of the filter.
w, h = signal.freqz(b, a)

fig = plt.figure()
plt.title('Digital filter frequency response')
ax1 = fig.add_subplot(111)

plt.plot(w, 20 * np.log10(abs(h)), 'b')
plt.ylabel('Amplitude [dB]', color='b')
plt.xlabel('Frequency [rad/sample]')

ax2 = ax1.twinx()
angles = np.unwrap(np.angle(h))
plt.plot(w, angles, 'g')
plt.ylabel('Angle (radians)', color='g')
plt.grid()
plt.axis('tight')
plt.show()
The magnitude and phase response of this filter are,
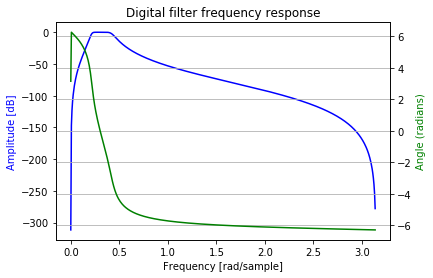
There are a lot of other issues that could be talked about here (i.e. non-linear phase response of the filter (i.e. green curve in the above figure is not linear in the passband), using FILTFILT to avoid distortion in the filtered signal due to the non-linear phase response of the filter, etc.), but I'm not going to talk about them.
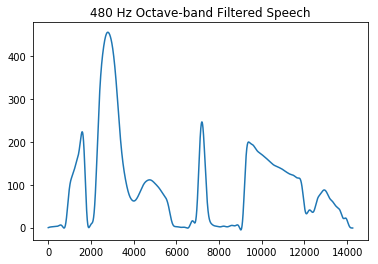
The 480 Hz octave-band filter can then be used to filter a speech signal. For example, consider this speech signal,
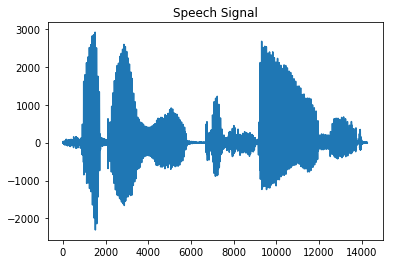
fs, speech=scipy.io.wavfile.read(filename='defineit.wav');
fig=plt.figure()
plt.title('Speech Signal')
plt.plot(speech)
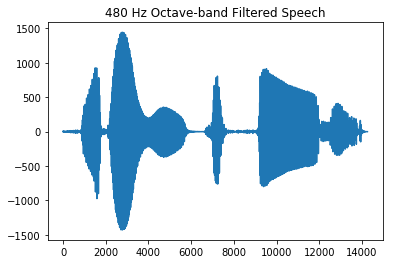
filteredSpeech=signal.filtfilt(b, a, speech)
fig=plt.figure()
plt.title('480 Hz Octave-band Filtered Speech')
plt.plot(filteredSpeech)and the filtered speech signal is,
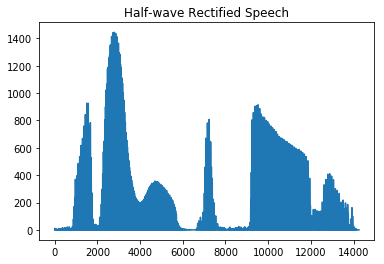
To extract the envelope of the filtered speech signal you need to half-wave rectify the signal and then apply a lowpass filter.
Simple half-wave rectification can be accomplished by setting negative values to zeros and not changing positive values in the speech signal.
The bandwidth of the lowpass filter governs the amount of information retained in the envelope signal. Here I used a 50 Hz lowpass filter.
speechRectified=filteredSpeech
speechRectified[speechRectified<0]=0
fig=plt.figure()
plt.title('Half-wave Rectified Speech')
plt.plot(speechRectified)
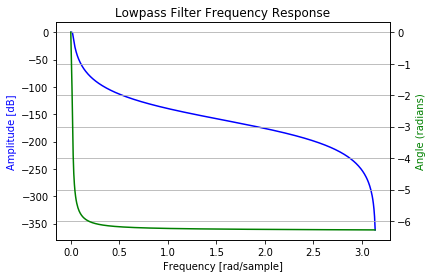
b, a = signal.butter( N=4, Wn=50.0/nyquistRate, btype='lowpass', analog=False, output='ba')
w, h = signal.freqz(b, a)
fig = plt.figure()
plt.title('Lowpass Filter Frequency Response')
ax1 = fig.add_subplot(111)
plt.plot(w, 20 * np.log10(abs(h)), 'b')
plt.ylabel('Amplitude [dB]', color='b')
plt.xlabel('Frequency [rad/sample]')
ax2 = ax1.twinx()
angles = np.unwrap(np.angle(h))
plt.plot(w, angles, 'g')
plt.ylabel('Angle (radians)', color='g')
plt.grid()
plt.axis('tight')
plt.show()
filteredSpeech=signal.filtfilt(b, a, speechRectified)
fig=plt.figure()
plt.title('480 Hz Octave-band Filtered Speech')
plt.plot(filteredSpeech)From the above code, the half-wave rectified speech signal is,
The lowpass filter frequency response is,
and the envelope of the lowpass filtered rectified speech signal is,
Again, there are a lot of details to keep in mind. Work through this and see how you proceed.
The order of both the bandpass filter and lowpass filter are 4. The order governs the amount of attenuation that is applied to frequencies outside the pass region of the filter. A higher order increases the attenuation, or roll-off.
I hope this helps.
Also see this article on digital envelope detection by Rick Lyons.
Thank you so much for the code examples. I ordered a dsp textbook and I'm trying to make sense of everything written down, like what exactly is butterworth. I really need some basic dsp knowledge to get it. The RNN and coding part is easy pzy for me. It's not even a challenge but the dsp filtering is a little over my head, thankfully I at least have a background in statistics and linear algebra which seem to be a requirement. I'll post back here soon with a full example one I get far enough.
You are welcome. If you have any questions, please let me know.
I am interested in seeing how your project progresses.
Michael.

Hello dingoegret. What DSP book did you buy?
Hi Rick, I bought Digital Signal Processing Principles Algorithms and Applications 4th edition. For a hefty, hefty price. Starting out I didn't get much use out of it. So I also got the Scientist and engineer's guide to dsp. This book has been a great help! Currently midway through.
Hi dingoegret.
Yep, the "DSP Principles Algorithms and Applications" is NOT for beginners, that's for sure. Many professors use that book for their 1st-semester DSP classes. Trying to learn DSP, from scratch, using that book is like trying to drink Kentucky bourbon from a fire hose. And that's why I say the most inefficient, most painful, way to learn DSP is by way of a college DSP class.
At the risk of praising someone else's DSP book, I confess that I like the "Scientist and engineer's Guide to DSP" book as a way to begin to learn DSP. Steven Smith's writing is clear, gentle, and comprehensive. You can tell from his writing that he wants to teach you signal processing rather than choke you to death with complex-variable algebra.
With that said, once you build up your knowledge of DSP, I predict that the "DSP Principles Algorithms and Applications" book will then be of considerable value to you.
LOL yup that is exactly how it felt to read DSP Principles Algorithms and Applications, bare naked as I was doing. I know college level Algebra and Calculus and have a background in Statistics.. but still felt like I was peeling back page by page the deep under belly of some sort of Necronomicon.
Luckily Scientist and engineer's Guide to DSP is gentle enough that I'm making steady progress to at least a fundamental understanding of DSP.
Even Nash, "Housewares", would recommend Smith's book.