


Frequency estimation in between the bins ...
DSP Gurus:
I am looking for some direction. I am working on a FMCW radar project. I have the IQ mixer sampling, zero padding, windowing and FFT all working. My problem is how do I get a substantially better frequency estimate of the IF frequency in between the bins?
For this effort, we want to utilize the phase information to achieve a sub millimeter accuracy. It's my understanding that after the complex FFT is performed the phase information is calculated with an atan2 function and then unwrapped. How do you do this? How do you offset the initial coarse bin to a fractional one? I see lots of research papers with the head spinning math that outlines these methods but I am not a mathematician. Can anybody offer some hand holding help?
Regards
Chris

The bad news is I don't really know the nature of your signal so I can't tell you how good these will be, but I don't think you can do better.
For parameter estimation (calculation if you have noiseless pure tone data), you don't want to window or zero pad. Just a raw straight FFT. Or if you you know ahead of time which bins the signal will be near, you only need to calculate those, not the whole spectrum.
If the signal is in between two bins, then you will want to use the two bin formula.
A Two Bin Exact Frequency Formula for a Pure Complex Tone in a DFT
https://www.dsprelated.com/showarticle/1039.php
If the signal is near a bin, you will want the three bin formula centered on that bin.
Three Bin Exact Frequency Formulas for a Pure Complex Tone in a DFT
https://www.dsprelated.com/showarticle/1043.php
The "squash" case is mathematically identical to Candan's 2013 formula, though quite different in form. Candan's formula is exact in the pure noiseless case, as are all of mine. This is important if precision is your goal. You can see that my "adjusted" case is more robust than the squash/Candan formulas in the presence of noise. I am not aware of any other exact formulas out there.
Once you have the frequency estimated/calculated, you can recover the amplitude and phase like this:
Phase and Amplitude Calculation for a Pure Complex Tone in a DFT using Multiple Bins
https://www.dsprelated.com/showarticle/1143.php
This is the most robust way I know of as well.
There is some sample source code and results provided in the articles. Let me know if you have any more questions or want some professional help.The math is pretty heavy, you can't get around that. I do my best in the articles to explain it and show every step of the derivations. The formulas are derived from an earlier article, so you may want to start with that.
DFT Bin Value Formulas for Pure Complex Toneshttps://www.dsprelated.com/showarticle/1038.php
Ced
P.S. This paper gives an objective comparison of various formulas:
http://www.tsdconseil.fr/log/scriptscilab/festim/f...
It does not have my latest 3 bin (adjusted) in it, which like I said is better than my 3 bin in the report and Candan's. My only criticism of the approach is he tests real and complex formulas against real and complex cases. I think it is important to make the distinction and separate them. The testing shows that real formulas don't work as well on complex cases, and vice versa.
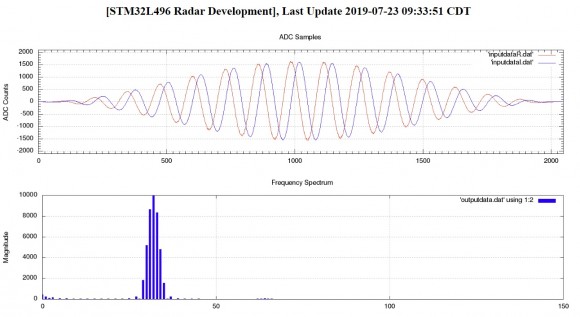
Your methods appear to be what I need. Attached is a code excerpt from the prototype efforts. Would you be willing to offer even more help and direction? I'm unsure of next steps. Waveform capture is a 1khz input from a dual channel function generator with 90 phase.
Is the time domain graph after you applied the VonHann (Lots of us don't like the "Hanning" label) window?
yes, the graph has Hann window applied.
Okay, for my formulas, you don't want to do that. I sent you an email. If that didn't work try me at cedron at protonmail dot com.

Hi. Slartibartfast gave you suggestions on finding more information about “fine” frequency estimation using FFT samples. To add to his list, you should also visit the following web pages created by Eric Jacobsen (a DSP Guru in the art of “frequency estimation”):
By my testing, all those are obsolete. None are exact, most require a lot of points to be near accurate, and none are as robust in noise as the ones I presented. Jacobsen's Estimator is an approximation of my original real 3 bin formula (since superceded by the one mentioned above), and it is also an approximation of Candan's 2013 (which is actually a tweak of Jacobsen's) and my original complex 3 bin formula (also superceded by the one mentioned above).
If anyone has any contrary testing, I would be interested in seeing it. In the high SNR scenarios, there is no question mine are better, with lots of noise or nearby tones (which are removable by estimating them and subtracting), it may not be the case, though I haven't seen it.
Extremely low SNR (<0db) has some other techniques, which may be better. This is not an interest area of mine.
In any particular application, if the noise level is high enough, a simple approximation may be adequate. That's why I put the qualifier of not knowing the nature of the signal in my answer.
Once the frequency is calculated, the phase method I presented is the most robust I know. How many bins should be used at what level of noise and where the frequency is relative to the nearest bin is still a bit of an open question. A good rule of thumb is if the frequency is near a bin, use a 3 bin set. For frequency in the middle of bins, either a 2 bin set or a 4 bin set should be used.
Ced

There are a number of frequency estimation techniques that use the FFT output. A web search on "frequency estimation" and author's names like Candan, Aboutanios and Mulgrew, et al, will get you started. It is a well-studied area where there are still occasional new algorithms that pop up.

Can you give us a little more information?
What is the size if the FFT? How much zero padding did you have to do, since the % of zero padding defines the width of the sync smearing in the frequency domain?
If you windowed the FFT, then you smeared the information from one bin into at least the two adjacent bins, and maybe more, and visa versa. Plus the sync smearing on top of that.
I you are looking for sub millimeter accuracy, then you must be sampling at a very high rate, and you bandwidth must be pretty high.
For example, LTE standard sampling is 30.72MHz, which is a little over 9.7 m per sample. So to get sub millimeter, you will need to be able to resolve the sub samples to the equivalent of sampling at 9000*30.72 MHz.
Someone please correct me if my thinking has gone bonkers.

If you are after high resolution fft over some specific limited section of frequency domain then apply high resolution fft on that section only ignoring the rest. If that section is variable then map it to a suitable same location for fft computation.
The fft will have to be done by you (not any full length ip). I would think that targeting high frequency end for your fft will help reduce the logic you require for generating cos/sin tables(or twiddle factors).
Kaz


