


Frequency Response
The frequency response of an LTI filter may be defined as the
spectrum of the output signal divided by the spectrum of the input
signal. In this section, we show that the frequency response of any
LTI filter is given by its transfer function ![]() evaluated on the
unit circle, i.e.,
evaluated on the
unit circle, i.e.,
![]() . We then show that this is the same
result we got using sine-wave analysis in Chapter 1.
. We then show that this is the same
result we got using sine-wave analysis in Chapter 1.
Beginning with Eq.![]() (6.4), we have
(6.4), we have
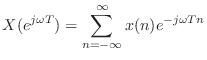
A basic property of the z transform is that, over the unit circle
![]() ,
we find the spectrum [84].8.1To show this, we set
,
we find the spectrum [84].8.1To show this, we set
![]() in the definition of the z transform,
Eq.
in the definition of the z transform,
Eq.![]() (6.1), to obtain
(6.1), to obtain
Applying this relation to
Thus, the spectrum of the filter output is just the input spectrum times the spectrum of the impulse response
This immediately implies the following:
We can express this mathematically by writing
By Eq.![]() (7.2), the frequency response specifies the gain and
phase shift applied by the filter at each frequency.
Since
(7.2), the frequency response specifies the gain and
phase shift applied by the filter at each frequency.
Since ![]() ,
, ![]() , and
, and ![]() are constants, the frequency response
are constants, the frequency response
![]() is only a function of radian frequency
is only a function of radian frequency ![]() . Since
. Since
![]() is real, the frequency response may be considered a
complex-valued function of a real variable. The response at frequency
is real, the frequency response may be considered a
complex-valued function of a real variable. The response at frequency
![]() Hz, for example, is
Hz, for example, is
![]() , where
, where ![]() is the sampling
period in seconds. It might be more convenient to define new
functions such as
is the sampling
period in seconds. It might be more convenient to define new
functions such as
![]() and write simply
and write simply
![]() instead of
having to write
instead of
having to write
![]() so often, but doing so would add a lot of new
functions to an already notation-rich scenario. Furthermore, writing
so often, but doing so would add a lot of new
functions to an already notation-rich scenario. Furthermore, writing
![]() makes explicit the connection between the transfer function
and the frequency response.
makes explicit the connection between the transfer function
and the frequency response.
Notice that defining the frequency response as a function of
![]() places the frequency ``axis'' on the unit circle in the complex
places the frequency ``axis'' on the unit circle in the complex
![]() plane, since
plane, since
![]() . As a result, adding multiples of the
sampling frequency to
. As a result, adding multiples of the
sampling frequency to ![]() corresponds to traversing
whole cycles around the unit circle, since
corresponds to traversing
whole cycles around the unit circle, since
We have seen that the spectrum is a particular slice through the
transfer function. It is also possible to go the other way and
generalize the spectrum (defined only over the unit circle) to the
entire ![]() plane by means of analytic continuation
(§D.2). Since analytic continuation is unique (for all
filters encountered in practice), we get the same result going either
direction.
plane by means of analytic continuation
(§D.2). Since analytic continuation is unique (for all
filters encountered in practice), we get the same result going either
direction.
Because every complex number ![]() can be represented as a magnitude
can be represented as a magnitude
![]() and angle
and angle
![]() , viz.,
, viz.,
![]() , the
frequency response
, the
frequency response
![]() may be decomposed into two real-valued
functions, the amplitude response
may be decomposed into two real-valued
functions, the amplitude response
![]() and the
phase response
and the
phase response
![]() . Formally, we may define them
as follows:
. Formally, we may define them
as follows:
Next Section:
Amplitude Response
Previous Section:
Problems


