


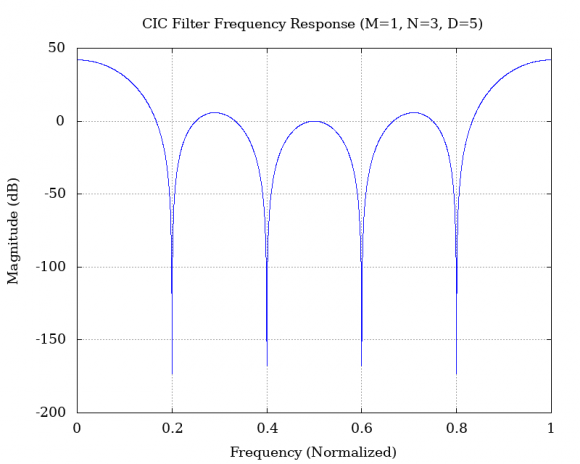
So this is a curious one. I am continuing investigating #CIC filters now that I have run @Rick Lyons tests and proven to myself that they are now correctly implemented. It involves the impulse response (or what I was looking for, the frequency response) of these filters.
One of the things I like about FIR filters is that you can send the unit impulse through them, and take the FFT of the result and see the frequency response of the filter. So naturally I plotted the FFT of the impulse response of the 3 stage, decimate by 5, CIC filter. Not surprisingly, depending on where in the decimation cycle the impulse comes in, the outputs of the filter change. So I wrote some code to send an impulse through at offset 0, 1, 2, 3, and 4 (since it is a decimate by 5 the sequence repeat). These are the first 10 values for each offset
Simple Impulse test, first 10 values:
Offset  0   1   2   3   4
--------------------------
[0] - 15, 10,  6,  3,  1
[1] - 10, 15, 18, 19, 18
[2] -  0,  0,  1,  3,  6
[3] -  0,  0,  0,  0,  0
... (all the rest of the values are 0
When you plot the FFTs of these you get this:
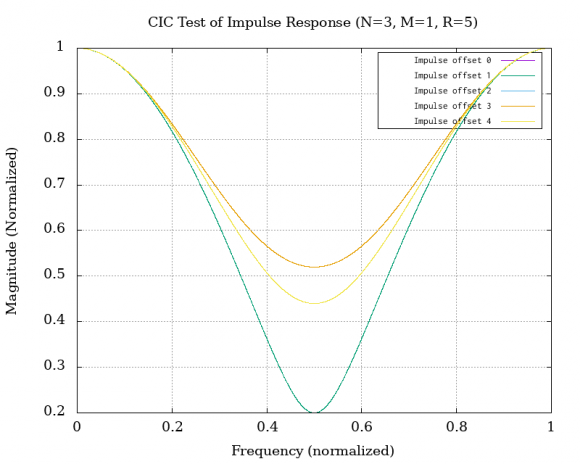
There are essentially three distinct plots for the three unique sequences from the output. I am at a loss to explain what this value would change. The spectral content shouldn't be different as far as I can tell.
Curious.
Those are the frequency responses of each individual 'polyphase' of the full FIR filter. The frequency response you're most likely interested in is that of the full FIR filter impulse, which is the interleaved version of those 'polyphase'. Try FFTing:
[1 3 6 10 15 18 19 18 15 10 6 3 1]
Should look more like what you're expecting.

Ok, that is pretty awesome!
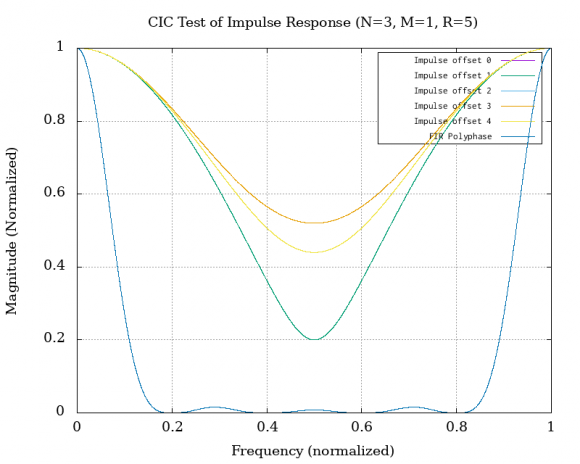
if the yaxis was in 'dB' it would even look like a normal frequency response!
Your right it does. Now nothing I've read about CIC filters talks about polyphase. That is something I need to understand, can you point me to a reference?
And as an update I've downloaded half a dozen papers that refer to implementing CIC filters using polyphase techniques. It will take me a bit to digest them.
My first reading is that each 'stage' of the CIC filter is one FIR phase. Thus a 3 stage CIC has 3 phases which is what I found for my example above. I will get to test this by tweaking to code a bit.
I would ignore the CIC filter part and read up about standard FIR filters and their polyphase implementation when used for decimation.
CIC is just a clever recursive way to implement a certain family of FIR filters,essentially an implementation detail.
How did you choose how to do the interleaving?
I'm not sure what you mean...
Start from the full FIR filter and pick every N samples...?
Thanks again @gretzteam for this insight, I'm trying to understand how you got it.
I started by looking at the different sequences that are generated by different arrival times of the unit impulse. If @Rick Lyons is reading along this might be a good addition to his test monograph.
I found the sum of the non-zero outputs to a unit impulse was a constant. That constant was \(M*(MD)^{(S-1)}\) where M is either 1 or 2, and D is the decimation rate and S is the number of stages. So for a the sample filter in the test paper, where M is 1, D is 5, and there are 3 stages, the constant is \(1 * (1 * 5)^2\) or 25.
The output values change depending on the arrival time of the impulse with respect to the decimation step. I printed them out above but I have recreated that in a diagram that shows the input, the outputs and the interleave you have proposed (color coded to show where the non-zero terms come from)
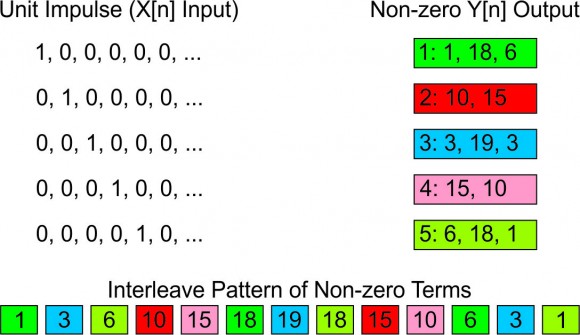
You can see that the interleave order (based on the 'number' of the output (1-5)) is one term from: 1,3,5,2,4,1,3,5,2,4,1,3,5
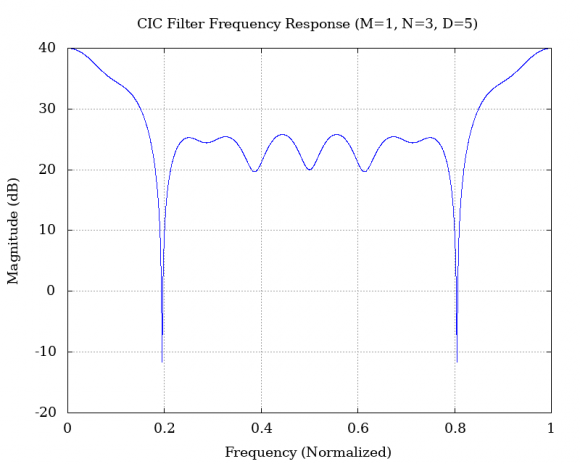
That gives you a nice frequency response plot:
But if the terms are ordered in any different way, you don't get this plot. (expected since the terms of the FIR are order dependent).
So I'm trying to figure out what is the "correct" sequence for an arbitrary filter (given, N, M, and D) to put the results in that will give me the frequency response plot I'm looking for.
I've been able to reason to all the other bits either logically or mathematically, this one is still eluding me.

Hi ChuckMcM,
I see your work interesting in that you use scanning impulse input to work out the original filter response that has been decimated.
I used a simpler fir filter and decimated it as 1:5 to reverse engineer the original response. From my work it seems the output samples map to original pre-decimation stage as follows:
y1(1) maps to y(1)
y5(2) maps to y(2)
y4(2) maps to y(3)
y3(2) maps to y(4)
y2(2) maps to y(5)
y1(2) maps to y(6)
y5(3) maps to y(7)
y4(3) maps to y(8)
y3(3) maps to y(9)
y2(3) maps to y(10)
y1(3) maps to y(11) ...etc.
y is the original reconstruced output,
y1 to y5 are outputs decimated in each case of impulse location
For your given outputs it mapped to [1,18,10,19,15,18,1,0,3,0,6]
Thanks for the response @kaz, plotting the frequency response of the taps you have gives this:
Not surprisingly I've got a number of different plots where I try to algorithmically pull out the taps and align them and get similar spectra.
Hi ChuckMcM,
I managed to model cic as per your setting. I get the following outputs:
impulse at 1: 1,18,6,0,
impulse at 2: 0,15,10,0,
impulse at 3: 0,10,15,0,
impulse at 4: 0,6,18,1,0
impulse at 5: 0,3,19,3,0
Thus following my above rules for reverse decimation the original filter before decimation is:
y=[1,3,6,10,15,18,19,18,15,10,6,3,1]; %same as your figures
I think your model may differ to mine with respect to initial conditions


