


Spurious when Fs/F is not an integer
We are using a 16bit DAC for a waveform generation between 0 to 500MHz with the sampling frequency of 1200MHz. The specification for the DAC performance is 10Hz frequency resolution throughout the band & >60dB SFDR. The spectral performance of the DAC is fine (more than 65dB SFDR) for the frequencies which is satisfying the condition,
Fs/F = Integer
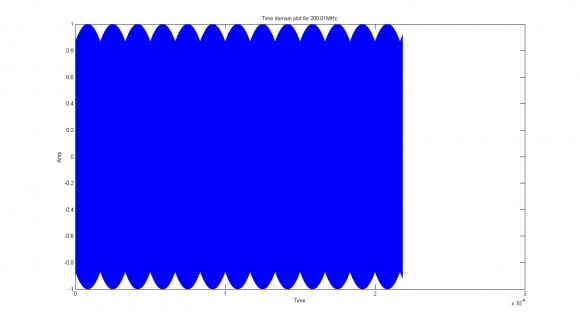
The frequencies which is not satisfying the above condition yields some spurious which is not meeting my SFDR spec. Since the samples of every cycle will not be same, it's creating an envelope over the waveform, due to a phase values repeating itself periodically over a no. of cycle. This envelope causing a spurious. If we generate a frequency of 200.01MHz in MATLAB with 1.2GHz Fs, we can clearly notice the Envelope with periodic time period of 16.65us (60KHz).
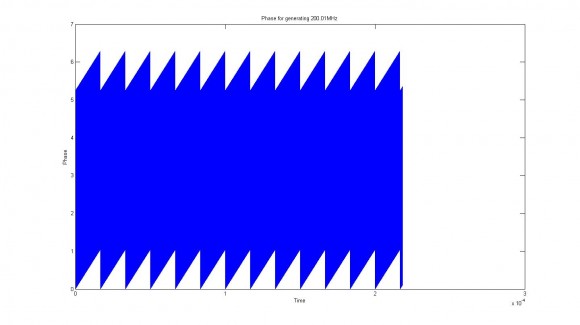
The below figures are the MATLAB Time domain plot for 200.01MHz & respective Phase.
Thanks & Regards
Loganathan N

A common practice for NCOs is phase dither. You can model that in Matlab to find optimum dither
Kaz
To elaborate on why phase dither is necessary -
You have a phase accumulator with a very large number of bits (or digits) to get 10 Hz of resolution at 500MHz. But you only use the 16 or so most significant bits of the phase accumulator to lookup and/or compute the sine wave amplitude. (ROM size and/or computation limitations)
So the lower bits in the phase accumulator are ignored and only increase the phase of the sine wave when the adder causes a carry into the higher bits. If you were to look at these lower bits of the accumulator you would find a sawtooth waveform. This is the phase error between the desired 200.01 MHz sine wave and the actual output.
Note that the average output frequency is correct, because the phase is periodically bumped by the lower bits of the accumulator.
Notice that if the programmed frequency is an integer submultiple of the sample frequency, the lower bits of the accumulator are always zero. Therefore, under this condition there is no phase error and the sine wave is clean.
Since the phase error is small, you can approximately compute the sideband levels caused by the sawtooth error without using Bessel functions. As suggested, you can use dither to break up the periodic nature of the phase error and convert the error to wideband noise.
John

Another common practice is to do linear interpolation based on the low-order wavetable address bits. Below, for example, is the interpolating sinusoid oscillator in the Faust distribution (faust.grame.fr).
//-----------------------`osci`------------------------
// Interpolated phase sine wave oscillator.
//
// #### Usage
//
// ```
// osci(freq) : _
// ```
//
// Where:
//
// * `freq`: the frequency of the wave (Hz)
//------------------------------------------------------------
osci(freq)    = s1 + d * (s2 - s1)
with {
    tablesize = 1 << 16;
    i = int(phasor(tablesize,freq));
    d = ma.decimal(phasor(tablesize,freq));
    s1 = rdtable(tablesize+1,sinwaveform(tablesize),i);
    s2 = rdtable(tablesize+1,sinwaveform(tablesize),i+1);
};
I've agreed with your suggestion. In Xilinx DDS IP Core, Phase dithered DDS option is available, that will introduce some random noise with the output of the phase accumulator to compensate for the phase truncation & I've tried that option. With that also I'm getting the same spurious. And without doing any phase truncation also I've tried, that's also gave the same.
The link for the Xilinx IP core data sheet Xlinx DDS IP Core DataSheet Link
In my case, I need to use 27bits in the phase accumulator to achieve 10Hz frequency resolution & 16bit data width for the DAC input.
If we are generating 200.01MHz with 1200MHz sampling frequency, we need to generate 5.9997 samples per cycle (1200/200.01). Which means we need to increase 60.003deg (360/5.9997) with consecutive samples.
The consecutive phase values for 200.01MHz will be
0, 60.003, 120.006, 180.009, 240.012, 300.015,
0.0018, 60.021, 120.024, 180.027, 240.030, 300.033,
0.036, 60.039, 120.042, 180.045, 240.048, 300.051.
If we look into the phase increment in every cycle, the difference will be 0.018deg. After 19996 samples(360/0.018) from the beginning, the phase will nearly role off. This will happen periodically. This will leads to an envelope over the waveform & this is not due to the Phase truncation.
Will you agree with that?
Thanks & Regards
Loganathan N
Hi Loganathan N,
Please be careful not to confuse the MatLab plot display with some real spurious modulation.
The plot of the waveform shows an envelope due to the decimation of the samples to fit the available pixels in the display, and does not represent any actual modulation.
Consider the following code:
-------------
% Experiment with aparent spurious frequency in sampled signal
clear all;
close all;
N = 2000000;
Fs = 1200e6;
aq = floor(32768.0*sin(2 * pi * 200.01e6 * [0:N-1]/Fs)+0.5)/32768;
figure;
plot([1:length(aq)]/Fs, aq)hh = ones(N,1);
% hann(N,1);
b = (2) * fft(hh.*aq')/N;
figure;
plot([0:length(b)/2-1]/length(b)*Fs,20*log10(abs(b([1:length(b)/2]))))
-------------
There is no evidence of the spurious components because of the fractional frequency offset.
The spurious frequencies must be created inside the D/A. The logical place for this issue will be in the interpolation and decimation filters, or in some non-linear components as mentioned by others.
Regards,
David
Indeed it is the other way round. if a frequency correlates with Fs it will result in spikes and dither helps here.
Kaz
Hi,
With MATLAB Spectrum Plot, How can we confirm that there is no spurious due to that envelope?
Because with MATLAB FFT Function, we'll get the same envelope for 200.01MHz. Hence our generated frequency (200.01MHz) will exactly correlated with the FFT Generated waveform. So, we cannot able to predict the spurious. With the spectrum analyzer (It may work on different clock domain), this envelope got predicted.
Thanks & Regards
Loganathan N

Hello Loganathan N. In your original post, the notion of "frequency resolution" makes no sense regarding a digital to analog converter. That's why I was confused. However, the notion of "frequency resolution" does makes sense with regard to a direct digital synthesizer (DDS).
I don't know if your time and freq plots are generated for some sort of software modeling or if they represent measured data an a real-world (physical) DDS. I am not sure what you're doing.
In any case I just want to say: If you plot the amplitude of a sine wave sequence (versus time) and that plot appears to have a fluctuating peak amplitude (fluctuating over time) those fluctuations do not mean that the sine wave is contaminated by some sort of spurious spectral components.
Taking advantage of dgshaw6's MATLAB code, I ask that you run the following MATLAB code. Notice the fluctuations in the peak amplitude of the sine wave in Figure 1. (I think you may be calling those fluctuations by the name: "envelope.") However, notice in Figure 2 that the spectrum of that sine wave shows only a single non-zero positive-frequency spectral component with no other "spurious" spectral components.
clear all;
N = 2^10
Fs = 1200e6;
Freq = 200*Fs/N
aq = floor(32768.0*sin(2 * pi * Freq * [0:N-1]/Fs)+0.5)/32768;
figure(1), clf
plot([1:length(aq)]/Fs, aq, '-bo', 'markersize', 2)
title('Time plot')
axis([1/Fs, length(aq)/Fs, -1.3, 1.3])
hh = ones(N,1);
b = (2) * fft(hh.*aq')/N;
figure(2), clf
plot(abs(b), '-rs')
title('Spec. Mag. plot')
grid on, zoom on
So my point is: seeing fluctuations in the peak amplitude of a pure sine wave's time plot does not mean that the sine wave contains "spurious" spectral components. Maybe you already know this.
Hi Rick Lyons,
Yes, You're right regarding the frequency resolution. It won't make any sense related to Digital Analog Converter(DAC).
My doubt is, How can we conform the spurious content with the MATLAB Spectral Plot?
In FFT Function e(-j*2*pi*K*n/N), it'll generate the same envelope kind of the thing, which will exactly correlate with our generated signal. Hence we won't get any spurious content. Hope I may be right.
Thanks & Regards
Loganathan N
Hi Rick Lyons,
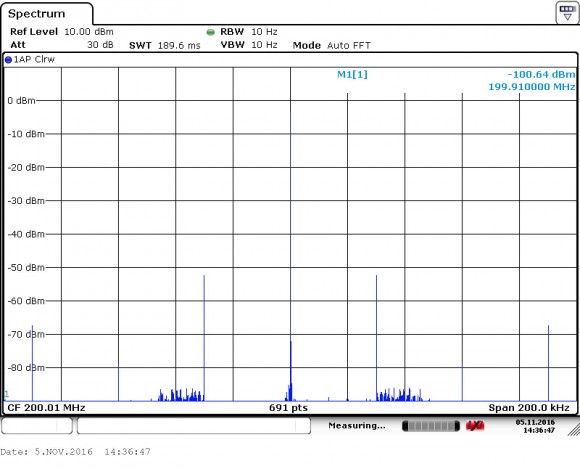
In my original post, that spectral plot has taken from spectrum analyzer, not from any software or any simulation.
In your MATLAB code, just increase the no. of samples to 2^16 or 2^18, then take the frequency as 200.01 or 150.001 or 80.001MHz. With that you can notice the envelope in the signal. But still your MATLAB spectral plot will look good.
If the envelope over the signal is not the cause for spurious, then, How the Spurious frequency got matched with the envelope frequency?
I've checked it out for some other frequencies also. Like 80.001MHz, 150.01MHz, 160.001MHz and so on.
If I'm notice my spectral with narrow band (200KHz) & very low Resolution BW (RBW)(10Hz) in the spectrum analyzer, then only I can able to point out the spurious. In wide band, I cannot able to point it out.
Thanks & Regards
Loganathan N
Waiting eagerly for your response
Thanks in advance
Loganathan N
Hi. I have two questions:
[1] What is the definition of "frequency resolution" with regard to a digital to analog converter.
[2] Are you able to post your MATLAB code here so we can see what you are doing?
Hi Rick Lyons,
1. I meant that discrete time waveform generation in FPGA should be within + or - 10Hz frequency resolution.
2. I've worked in MATLAB System Generator Tool for Xilinx Application. That's simple frequency generation with xilinx DDS IP Core. If you wish to see that MDL file, I'll send it to you.
Will you agree that this envelope will cause for spurious?
Thanks & Regards
Loganathan N

OK. You sucked me into playing with this for entirely too long.
If you're doing your math the way I'm doing my math then in theory you're fine -- do the FFT of that cosine wave with things lined up right, and you'll get a really nice looking answer. Introduce some high-order distortion (I clipped by 1/100 of 1%) and you'll get spurs galore.
I didn't try quantizing the signal in Matlab.
If another look doesn't show something obvious like clipping in a follow-on circuit or other nonlinearity, then I'd try to replicate the effect in Matlab. Use the nonlinearity of your choice and then take Kaz's suggestion of dithering the phase at the output of the NCO and see if it looks better. It looks like there's little enough energy in those spurs that if you spread it out they'll be way below your specification line.


