


How to efficiently control an FIR's magnitude response by altering its phase spectrum
Note: I posted this question on Signal Processing Stack Exchange yesterday. Because the one answer I got so far was not-so-satisfying, although surely well-intentioned, I'll post the question here to broaden the audience a little. If this goes against the forum rules in any way, please let me know and remove this thread if necessary.
Question:
Extensively searching the space of all possible vectors of length \( n \) to satisfy a (non-overdetermined) requirement is possible in principle. Hence, there is a way to calculate a complex FIR kernel of length \( n \) whose magnitude response goes through \( 2n \) given points, when its phase response is allowed to be completely arbitrary. (Corollary, a real FIR kernel with \( n \) given magnitude points and \( n \) mirrored points can be calculated.) The extensive search method is hopelessly inefficient, though. Is there a practical way to calculate an FIR with such requirements?
Context:
It is common DSP practice to use the DFT to convert an array of real magnitude points \( M = \{m_0, m_1, \dots, m_{n-2}, m_{n-1}\} \), \( m_i \in \mathbb{R} \) along with an array of real phase points \( P = \{p_0, p_1, \dots, p_{n-2}, p_{n-1}\} \), \( p_i \in \mathbb{R} \) to an FIR kernel \( K = \{k_0, k_1, \dots, k_{n-2}, k_{n-1}\} \). \( K \)'s elements are generally complex, but if \( M \) is symmetric (i.e. \( m_i = m_{n-i} \) for \( 0 < i < \frac{n}{2} \)) and \( P \) is conjugate symmetric (i.e. \( p_i = - p_{n-i} \) for \( 0 < i < \frac{n}{2} \)), then \( P \)'s elements are completely real.
The magnitude response (absolute value of the DFT) of \( K \) will always match \( M \) at the individual points \( m_i \). Between these fixed points, however, it can attain very unintuitive and undesirable values. This undesirable behavior can easily be visualized by appending a large number of zeros to \( K \) and then calculating the absolute value of the DFT. Changing any \( p_i \) changes the behavior of the magnitude response of \( K \) in between the \( m_i \). Thus, two FIRs derived from the same magnitude spectrum \( M \), but with different phase spectra \( P \), can have very dissimilar magnitude responses. This is illustrated by the figure below:
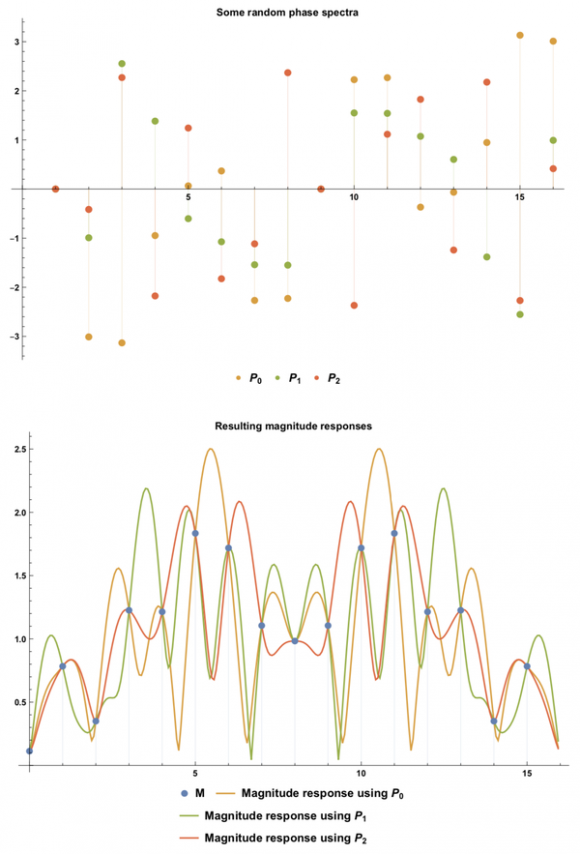
The upper plot shows three randomly chosen examples of \( P \), called \( P_0 \), \( P_1 \) and \( P_2 \). The lower plot shows a randomly chosen example of \( M \) and the resulting magnitude responses when an FIR kernel is formed using \( M \) as the magnitude spectrum and one of the \( P_i \) as the corresponding phase spectrum. \( n \) was chosen to be \( 16 \) here. The three magnitude responses all go through the fixed set of points defined by \( M \), but vary considerably everywhere else, due to their different phase spectra.
There are many audio applications where we do not really care about the phase response of a filter, but we absolutely do care about the magnitude response. Given a magnitude spectrum \( M \), we can hence regard all the \( p_i \) as degrees of freedom to shape our magnitude response. More specifically, this should allow us to define \( n \) additional magnitude points that the magnitude response of \( K \) is required to go through. These additional requirements should be able to help to substantially reduce any undesirable magnitude response behavior of \( K \) without the need to increase its length \( n \). Calculating \( P \) to satisfy such additional requirements seems nontrivial, though.
Are my assumptions correct? Am I missing something? Is there any practical (polynomial complexity) way to do this?
#Audio #FFT #FIR #Convolution #Optimization #Phase

I am trying to clarify your question first...It seems you are simply asking how to design a FIR digital filter optimised for amplitude response assuming it doesn't care about phase response at all.
If so I don't know because current FIR designs are effective anyway as far as I am concerned. But sure your thoughts are worth further discussion.
Hi kaz! Thanks for your reply. You are correct. I want to gain as much freedom as possible over the amplitude response for a given filter length while not caring about the phase response at all.
I think my question ultimately comes down to whether there is a feasible way to interpolate a complex polynomial based only on its absolute value, since the FIR kernel's frequency response can be found by constructing a complex polynomial from the kernel's coefficients and evaluating it on the unit circle. I want to pose as many requirements for that polynomial's absolute value as possible. I have also posted a separate question on Computer Science Stack Exchange to address this particular "sub-question". Let's see if there is any insight to be gained...
Your question is worrying me. (besides: I need to translate it to german before I can try to understand your desire)
When you want to see the amplitude response of a FIR filter, you simply need to look on the filter kernel itself. This is exactly, what you get, when you feed a dirac impulse into the filter. This is simply time domaine.
But I fear, you want to set up a FIR filter, that shows a FREQUENCY response, which you want to be able to set it up as you desire. Such a frequency response, which is not only one of the usual lowpass, highpass, bandpass etc. but rather a response, where it meets some points (Y=amplitude of your choice, X=frequency of your choice) more or less exactly - while the amplitude between the choosen frequency points are of less concern to you.
Did I interpret your desire in the right direction or misunderstood I the point?
This is an old problem. I would suggest book by Manfred Schroeder,
Number Theory in Science and Communication: with applications in Cryptography, Physics, Biology, Digital Information, and Computing.
I have used this in the design of a Shaker control drive signal. To minimize time domain peak to average ratio (to avoid clipping signal) we loaded power spectral levels and then used quadratic phase with slope proportional to spectral amplitude: and then apply spectrum to random white spectrum and IFFT to form time signal with given spectrum and with low papr. Worked like a charm. Can use straight quadtratic phase to illustrate concept. The Schroeder book uses the same trick to use reflectors to tune the acoustics of large auditoriums to suppress acoustic dead spots in the hall.
fred harris
Hi Fred, thanks for the book suggestion. I will check that out.
I am unfortunately not sure I understand the method you are describing. You used a quadratic phase array to reduce the peak to average power ratio, right? Does this relate to my initial question or is it simply an example of the tricks presented in the book?
The problem I was solving was building a control signal with a given power spectra but with a small PAPR. That's why I modified the white noise by a spectral product prior to IFFT
For the filter design problem. You have the desired spectral amplitudes. We now add correlated phase in the way to reduce the peak to average values of the time series. If all the phases are zeros (with an added linear component to make the filter causal) we will have a sinx/x like impulse response when you take the IFFT. By putting quadratic phase on the spectral samples we smear the time signal and reduce the PAPR. Try it with successively larger quadratic phase to see the smearing effect.
This is a trick we also use in beam forming, we can use quadratic phase across the array elements in a beam former to spoil the beam--- widen the mainlobe beam width.
fred
Hi wolf22, I think you mostly understood my question, though not 100% correctly.
I want to calculate a FIR filter, whose frequency response I want to exactly define at specific positions. This FIR filter need not be a traditional low pass, high pass, etc. It should be allowed to have an arbitrary, dare I say random frequency response (which is user defined). So far, so good. :)
The typical way to calculate the kernel (meaning the impulse response) of such a filter is to define an array of complex numbers, which describes the frequency response (in the frequency domain). After applying the Discrete Fourier Transform, the searched-for impulse response is found. Although the actual (continuous) frequency response of this impulse response goes through the points defined in the array, it can vary very unexpectedly in between. I am only interested in the absolute value of the frequency response. I do not care about the filter’s effects on the phase of different frequencies. Hence, I will initially define an array of real, positive numbers that only describes the absolute value of the frequency response. Since the phase values are freely adjustable now, I have additional degrees of freedom which I can exploit in order to minimize the unexpected behavior of the resulting frequency response. This means I can define some the absolute value of the frequency response at some additional frequencies. Using the right phase values to convert my array of real values into an array of complex values, the resulting filter will satisfy these additional definitions. Now, the question is how to calculate these phase values efficiently.
If you have trouble with the english version, here’s the above in german:
Ich möchte ein FIR-Filter berechnen, dessen Frequenzgang ich an bestimmten Stellen genau definieren will. Dieses FIR-Filter muss kein herkömmlicher Tiefpass, Hochpass, o.ä. sein, sondern darf einen beliebigen und potenziell sehr komplexen, fast schon zufälligen Frequenzgang haben (der eben anfangs definiert wurde). So weit, so gut. :)
Typischerweise kann man den Kernel (also die Impulsantwort) eines solchen Filters berechnen, indem man ein Array komplexer zahlen definiert, das den Frequenzgang (im Frequenzbereich) beschreibt. Wendet man darauf die diskrete Fouriertransformation an, erhält man die gesuchte Impulsantwort. Der tatsächliche (kontinuierliche) Frequenzgang der Impulsantwort geht nun zwar durch die im Array definierten Punkte, kann dazwischen aber sehr anders als erwartet aussehen. Mich interessiert nur der Absolutwert des Frequenzgangs. Welchen Effekt das Filter auf die Phase verschiedener Frequenzen hat, ist mir egal. Deshalb möchte ich zu Beginn nur ein Array von reellen, positiven Zahlen definieren, das den Absolutwert des Frequenzgangs beschreibt. Da die Phasenwerte nun frei wählbar sind, habe ich offene Freiheitsgrade die ich nutzen kann, um das unerwartete Verhalten des resultierenden Frequenzgangs zu minimieren. Ich kann also für zusätzliche Frequenzen Absolutwerte des Frequenzgangs bestimmen. Wenn ich mein Array mit den richtigen Phasenwerten in ein komplexes Array umwandle, wird das Filter diese zusätzlichen Bestimmungen einhalten. Die Frage ist nun, wie ich diese Phasenwerte effizient berechnen kann.
Thanks for the translation.
Now.. one week of silence here - and I have not a solution for your problem, but some kind of hint: Probably you know the nice book "The Scientist and Engineer's Guide to Digital Signal Processing". In chapter 17 (from page 297 ff.) the autor describes a method for creating custom filters with arbitrary frequency responses (but without respect to phase responses). He also gives a tiny BASIC-Code for calculating such filters. But be warned: I assume, that the resulting filters are rather approximations and not the exact solution.
Thanks! Yes, that wonderful book taught me a lot about signal processing years ago.
Steven (the author) touches on the topic I'm interested in:
Now consider this: what does the frequency response do between the specified points? For simplicity, two cases can be imagined, one "good" and one "bad." In the "good" case, the frequency response is a smooth curve between the defined samples. In the "bad" case, there are wild fluctuations between. As luck would have it, the impulse response in (b) corresponds to the "bad" frequency response. This can be shown by padding it with a large number of zeros, and then taking the DFT. The frequency response obtained by this method will show the erratic behavior between the originally defined samples, and look just awful.
He then goes on to explain why windowing helps to make the frequency response look "well-behaved". What I'm interested in are all the possible ways the frequency response can look when adjusting the phase spectrum while leaving the magnitude spectrum fixed. I would like to be able to adjust the phase spectrum in a way so that the magnitude response satisfies some additional requirements I impose (i.e. some extra magnitude points).
I just played with ifft of Matlab and the way one might design example LPF FIR based on that, here is my code, starting from required amplitude:
%%%%%%%%%%%%%%%%%%%%%%%%%%%%%%%%%%%%
Amp = [1 1 1 1 0 0 0 0 0 0 0 0];
Amp = [Amp, fliplr(Amp(2:end))]; % full frequency cycle
h = real(fftshift(ifft(Amp))); %discard imaginary values
h = h/sum(h); %normalise
plot(h,'-o')
%%%%%%%%%%%%%%%%%%%%%%%%%%%%%%%%%%%%%
This tells me that phase is not included at start, moreover I discarded the imaginary part of iFFT yet if look at my (h) response using fft(or freqz) then phase is automatically there and linear.
So using ifft approach as such is blind to phase. I assume that is why an alternative such as polynomial solution has to be considered.
I am afraid I disagree here. The Vector Amp may be viewed as points of amplitude with same phase. But multiplying it with random numbers will distort the result...I am sure.
However if we have (Amp_real & Amp_image), do ifft, then we are defining both Amp and phase. As such if absolute of that is same you should get same response for Amp but phase can be varied at will.
So may be just iterate values of Re/Im targeting a given Amp until you achieve the filter with lowest order.
% quad phase FIR filter
for k=1:80
H0=zeros(1,64);
H0(33+(-7:7))=[0.23 0.77 ones(1,11) 0.77 0.23];
H1=[0 H0(2:64).*exp(+1i*2*pi*0.0002*k*(-31:31).^2)];
H1=fftshift(H1);
h11=fftshift(fft(H1));
h1=h11(1:64);
h1=h1/sum(h1);
figure(22)
subplot(2,1,1)
stem(-32:31,h1,'linewidth',2);
grid on
axis([-32 32 -0.08 0.22])
title('Impulse Response, Changing Peak Amplitude While Preserving Spectral Response')
xlabel('Time Index')
ylabel('Amplitude')
text(13, 0.14,'Changing Spectral Phase','fontsize',14 )
text(12,0.12,['Quadratic Phase: 0.0002*',num2str(k),' k^2'],'fontsize',14)
subplot(2,1,2)
stem(-32:31,abs(fftshift((H1))),'linewidth',2)
hold on
g1=zeros(1,1024);
g1(513+(-32:31))=h1;
g1(513-32)=0.5*g1(513-32);
g1(513+32)=conj(g1(513-32));
g1=fftshift(g1);
plot((-0.5:1/1024:0.5-1/1024)*64,fftshift(abs(fft(g1,1024))),'linewidth',2)
hold off
grid on
axis([-32 32 -0.1 1.2])
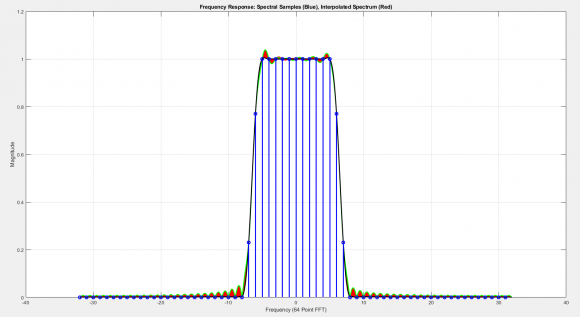
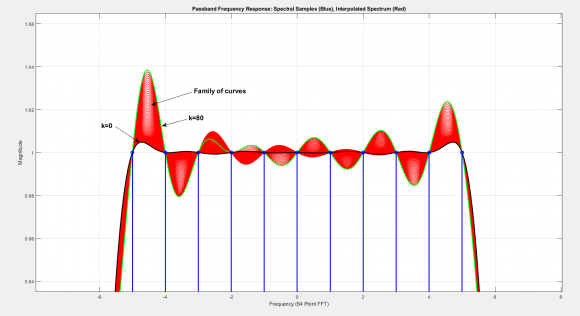
title('Frequency Response: Spectral Samples (Blue), Interpolated Spectrum (Red)')
xlabel('Frequency (64 Point FFT)')
ylabel('Magnitude')
text(13, 0.75,'Spectral Phase Profile','fontsize',14 )
text(12,0.65,['Quadratic Phase: 0.0002*',num2str(k),' k^2'],'fontsize',14)
pause(0.2)
end
Run this matlab code to see an animated script showing fixed sampled spectrum with different impulse responses formed by applying quadratic phase to spectral samples.
fred harris

Hi fred.
That's a neat demo routine! If just after your
H1=[0 H0(2:64).*exp(+1i*2*pi*0.0002*k*(-31:31).^2)];
command we insert the following six lines of code we'll see an interesting plot.
figure(10), clf
title('Phase of H1'), ylabel('Radians')
axis([0, 64, -9, pi]), grid on
hold on, plot(abs(H1), '--k')
Phase = unwrap(atan2(imag(H1), real(H1)));
plot(Phase, '-rs', 'markersize', 2), hold off
Very interesting how your animation clearly demonstrates that phase can impact the interpolated points while preserving the magnitude of the original response.
Sorry for the late reply and thank you for the script. Among other things, the animation nicely showcases what I was trying to point out by the graphics in my original post: The magnitude response between fixed magnitude samples varies depending on the phase specified at these samples.
Since my original post, I have learned that this "in-between" (interpolated) magnitude response cannot generally be adjusted to go through some additional given magnitude sample(s). Though in some special cases, it is possible to satisfy such additional requirements. Here is a more detailed explanation.
I'm now wondering if there are other practical ways to adjust the magnitude response between the given sampled spectrum to one's likings without iterating through a huge number of combinations of phase values. In particular, I'm wondering if there is a way to find out what kinds of additional magnitude samples the magnitude response can go through (or, more generally, what kinds of requirements a magnitude response can satisfy beyond the fixed sampled spectrum).
Reading back your various posts here your issue gets unclear. If you are targeting a real fir at the end then it has to be non-symmetric as otherwise it has linear phase as usual. So your absolute value(Amplitude) to be passed through iDFT must not show mirroring. You cannot therefore use mirrored Amp multiplied by random complex number as eventually you take only the real part and will be symmetric.
i.e. you may play with mirroring of amplitude rather than use random complex multiplication.
If you are targeting complex filter to achieve arbitrary Amp or phase then that is well known but how you can use complex filter instead of real filter to reduce resource?
So I think your question is far from clear in purpose or target application.
Don't confuse linear phase with even symmetric. Normally linear phase comes from a zero phase design which builds a non causal impulse response... the linear phase comes from the time shift to make it causal. The quadratic phase on top of the linear component maintains Hermetian symmetry with a real impulse response... (The quadratic phase widens the main lobe impulse response.. this is the beam spoiling I referred to in the phased array beam former)
fred
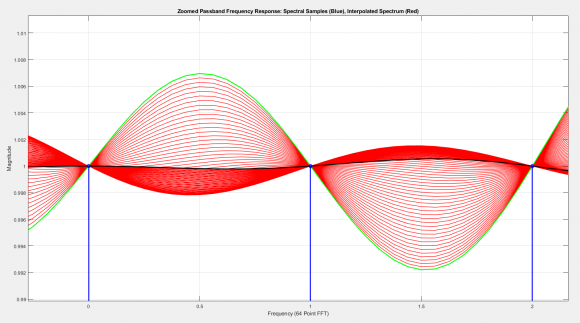
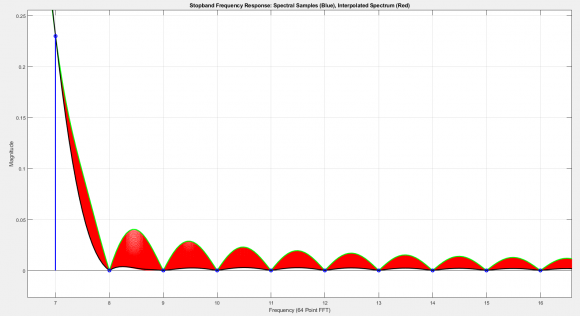
Perhaps obvious to others but what I found interesting in the animation was the following.
As expected, the magnitude response is invariant to a nonlinear phase (vs. frequency) response applied to the original spectral samples. That is, no change in magnitude occurs at the frequencies of these samples.
However the response varies noticeably at other frequencies as indicated by the interpolated response animation and the zoomed in views given below.
The OP inquired about efficient methods to control the magnitude response at these "in-between" frequencies. I know of no such methods but my gut tells me that first principles (of discrete signals) can be used to derive both methods and limitations.
I agree you can design a complex filter with bias towards amplitude over phase response but the original post is looking for practical applications such as some audio cases.
This is contradictory as you are moving from simpler real filter to a complex one needing 4 multipliers per tap and additional design overheads of audio input/output to be complex as well.
I was of the view that the target is still real only filter in which case we need to play with symmetry; distort it to get better amplitude. Sounds very impractical to me.


