


I am having difficulties accepting the validity of FFT interpolation / time domain zero padding.
When a section of time data of length T is selected from which to produce an FFT, it is implicitly assumed that this repeats ad infinitum from the beginning to the end of time. This means that the signal can only contain components having frequencies that are a multiple of 1/T – as calculated by the FFT. Therefore, it makes no senses to interpolate between these frequencies – there is nothing there.
Zero-padding in the time domain is said to produce an interpolated FFT, but the ‘Proof’ for justifying zero-padding just shows that where the frequency bins of the original and interpolated FFT correspond, they are the same. As far as I can tell this in no way shows the interpolation is correct. A similar logic could be used to ‘prove’ that linear interpolation is correct! Instead of zero padding, multiple repeats of the FFT block could be used to generate the FFT, and this would give the correct result.
What is wrong with my logic?
Apologies for the lack of mathematical rigour.

Hello MrColly.
Your second paragraph contains two misconceptions. The first misconception is that an FFT assumes its input sequence repeats itself. Only a living creature, with a brain, can make an assumption. The FFT algorithm is not a living creature. The FFT can no more “make an assumption” that a square root operation, or a natural logarithm operation, can make an assumption.
The second misconception in your second paragraph is your inference that an FFT’s input sequence “can only contain components having frequencies that are a multiple of 1/T.” The true spectral magnitude of a finite-length sequence of numbers is a continuous, infinite-resolution, infinitely fine-grained, curve. And that curve is called the “discrete-time Fourier transform” (DTFT) of a finite-length sequence of numbers. We can think about such DTFT curves, we can draw pictures of such continuous curves, and on paper we can write equations representing such curves. Most DSP books contain drawings of continuous DTFT curves and present continuous DTFT equations.
However, the frequency variable in DTFT equations is continuous which means we can’t use a computer to compute a continuous DTFT spectral curve. The best we can do with a computer is compute spectral magnitude samples that lie on a DTFT curve. And that is exactly what the FFT is doing. The FFT computes periodic samples of a sequence’s continuous DTFT spectral magnitude curve. And, as you know, we can reduce the spacing between the computed spectral magnitude samples by zero padding the FFT’s input sequence and performing larger-sized FFTs.
Also, "multiple repeats" of a finite-length time sequence (concatenating a sequence onto itself multiple times) and performing a larger-sized FFT does not generate any new spectral information beyond what is contained in the FFT of a single non-repeated input sequence.
My turn: The Fourier transform of a sampled data time series is a continuous periodic function of frequency. This is the Sampled Data Fourier Transform. We can use the DFT to sample the continuous function where you ask it to. When we sample the spectrum, the time domain samples become periodic. We can choose any frequency domain sample rate we choose... there is a minimum sample rate required to keep the periodic copies of the time series from overlapping (time domain aliasing) for an N-point sequence the frequency domain spacing, delta-f, is fs/N. We can select a denser set of samples, with spacing fs/(2N) or fs/(8N). The FFT algorithm will accommodate the request for denser (closer spacing) sample by zero padding the N-point sequence to 2N or 8N samples and the DFT samples formed are precisely the desired denser set of samples. Matlab doesn't require the zero extension, but instead asks for number of output samples, such as fft(h(1:16),128)
This is a standard HW problem: to see the interpolation of the spectral Dirichlet kernel associated with the sampled rectangle zeros(1,16)/16
plot((0.5:1/16:0.5-1/16),abs(fft(ones(1,16)/16),'b');
hold on
plot((0.5:1/32:0.5-1/32),abs(fft(ones(1,16)/16,32),'r');
plot((0.5-1/64:0.5-1/64),abs(fft(ones(1,16)/16,64),'c');
plot((0.5-1/128:0.5-1/128),abs(fft(ones(1,16)/16,128),'k');
hold off
grid on
fred
Hi Fred,
It's been a while, but this thread still seems to be near the top of the pile.
Surely, the best interpretation of your time signal, ones(1,16)/16) (Matlab code) is that it is just a DC signal. Zero padding turns it into a square wave, which cannot be correct.
NB Zero padded results are plotted in a later answer from Rick.
Colin

"The true spectral magnitude of a finite-length sequence of numbers is a continuous, infinite-resolution, infinitely fine-grained, curve."
Uh -- point of order, honored chairperson:
The four possible Fourier transforms (why did I just now notice that it's the Fourier transform) are:
Time domain: Frequency domain:
infinite, continuous <--> infinite, continuous (i.e., Fourier transform)
finite, continuous <--> infinite, discrete (i.e., Fourier series)
infinite, discrete <--> finite, continuous (i.e., discrete-time Fourier transform)
finite, discrete <--> finite, discrete (i.e., discrete Fourier transform).
The spectral magnitude of a finite length of discrete numbers is of finite length and discrete. The spectral magnitude of an infinite length of discrete numbers is, indeed continuous, with the infinite resolution and infinitely fine grain that continuity implies.

I would replace the word "finite" with "periodic".
It works for any finite domain, whether that finite-length thing represents the problem's entire world, or just one cycle of an infinitely repeating signal.
But then you have to toss in the modulo indexing in order to use the theorems in your "(i.e., discrete Fourier transform)". That modulo indexing makes it periodic.
Uniform sampling in one domain necessarily imposes periodicity in the reciprocal domain.
Imposing periodicity in one domain results in uniform sampling in the reciprocal domain.
This is always true. Always.
I'm trying to remember who it was that was hard over on the "no, it's just a finite domain, don't make it periodic". I think it was Rune Alnor.
Hi Lyons, i met a problem that in a large 2D signal(32k*32k), there are only a small part(6k*2k) is none zero. is there any way that i can get the 2D fft result of the original signal( 32k*32k )by the small part (6k*2k) using some ways like interpolation.
Hello Robert2017.
I suggest you post your above question (to me) as a "new" question on this Forum.
Good Luck.

That is one valid way to look at it, but not the only way. The DFT is just a matrix multiply of an input vector by a transformation matrix. There do not need to be any assumptions about the repetition of the input vector, as the effects of a rectangular window about the input vector fully explain the output behavior. This includes a sinx/x frequency response for each DFT output bin. Interpolating by zero padding the input creates additional samples along the sinx/x bin responses, which can be very useful.
e.g., two tones in adjacent bins can be "resolved" by zero-pad interpolating and seeing the "scalloping" dip between the two sinx/x responses. Since no information is added the width of the sinx/x isn't reduced or its shape changed, but it is often possible to see details that aren't fully resolvable before interpolating. It is also a very effective method of smoothing the output.
I hope that helps a little bit.
Well, this is an old issue with me and Eric that dates back to the mid 1990s on comp.dsp . I must differ with Eric where he writes:
"There do not need to be any assumptions about the repetition of the input vector, as the effects of a rectangular window about the input vector fully explain the output behavior."
In fact, the DFT and the Discrete Fourier Series, are one-and-the-same. The DFT maps one period of length \( N \) of a periodic sequence in the discrete-"time" domain to a period, also of length \( N \), of a periodic sequence in the discrete-"frequency" domain. This periodicity is inherent and must be considered when any theorem involving the DFT that involves shifting or translating in time or frequency is used. This is why you sometimes see notation for modulo arithmetic operating on the indices of \( x[n] \) or \( X[k] \) with these theorems, but for me it's a lot easier to just say:
$$ x[n+N] = x[n] \qquad \forall n \in \mathbb{Z} $$
and
$$ X[k+N] = X[k] \qquad \forall k \in \mathbb{Z} $$
Simply accepting and remembering that inherent periodicity allows one to ditch the \( (n-n_0)\mod{N} \) notation for the indices when one shifts \( x[n] \) by \( n_0 \) samples.
The rectangular windowing happens when one yanks out \( N \) adjacent samples from a stream of samples that is much longer. Then the question is: "What does one do with the samples outside of those \( N \) adjacent samples that have been yanked?" If we define them to be zero, that is zero-padding and the Fourier Transform of that infinitely long, padded sequence (what we call the "DTFT") is a continuous-frequency function of \( \omega \) that repeats every interval of \( 2\pi \).
Sorry Stephan, but I have to refer to a competing forum.
This is my rigid nazi-like position on this issue:
https://dsp.stackexchange.com/questions/18144/about-discrete-fourier-transform-vs-discrete-fourier-series/18157#18157
Well there is nothing wrong with your reasoning. You maybe just forget that, as anybody else, you cannot invent data that you do not know. In this sense the linear interpolation is very good if you 'make the hypothesis' that the signal is piece-wise linear (and that by chance you sample at the good rate), so you can 'reinvent' the data in between samples. But, IN THE HYPOTHESIS, that the signal is band limited AND periodic (and you have chosen a sampling frequency multiple of this band) than the FFT will reinvent values between samples. Now both approaches meet together if you accept windowing.
Welcome to a world where there is no proof, just rules of thumb, .. and modelling (where you decree that a model is the TRUE representation of reality).
Here's the thinking that works for me:
The DFT (of which the FFT is just an algorithm for fast computation) is exact for the data it's given, and mathematically at least it does not lose information -- IFFT(FFT(x)) is equal to x.
When you take a sequence of numbers that is infinitely long and you select some finite-length sub-sequence to do an FFT upon, you are making an approximation of the original sequence, and you'd darn well better know how you're approximating, why you're approximating, and what that approximation actually represents. At best, you're taking a sample that's quite representative of the whole; at worst you're getting some irrelevant and meaningless data. You need to understand the general nature of the thing you're getting a sample of to do that.
After that (or before that) it gets worse: when you take a continuous-time function and you take samples of it at discrete times, you are making an approximation of the original function -- and just insert my earlier rant word-for-word, it applies here, too.
So, if you have sampled a continuous-time function correctly, and if can and have selected a representative finite-length section of that function for analysis via FFT, and if the original process that generated that original function is amenable to it, then doing between-the-bin interpolations is a perfectly reasonable thing to do. But there are three "ifs" in there, and it's your job to understand the sampling process, the truncation process, and the FFT well enough to know if you can subsequently do the interpolation and get a meaningful result.
Hi. Here's my follow-up comment: In my earlier 'Reply' my phrase "true spectral magnitude of a finite-length sequence" is referring to the discrete-time Fourier transform (DTFT), one version of which is:
where the omega frequency variable is continuous. The above equation shows an infinite length x(n) input, but that is NOT necessary. The above equation is also correct for finite-length inputs. When I write the above equation for an N-sample x(n) input I prefer to have the lower limit of the summation to be 'n=0' and the upper limit be 'N-1'.
To use fred's FFT input sequence example of 16 unity-valued time samples, the black continuous curves below show the positive-frequency magnitude spectrum of the input sequence's DTFT. Those curves are the first half-period of what fred calls the "Sampled Data Fourier Transform."
The red dots in the left panel below are the 16-point FFT positive-frequency spectral magnitude samples. Zero padding the 16 unity-valued input samples samples with 16 zero-valued samples produces the 32-point FFT red dot positive-frequency spectral magnitude samples in the center panel below.
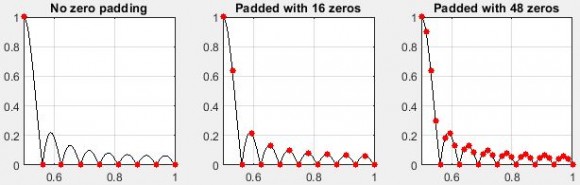
Zero padding the 16 unity-valued input samples samples with 48 zero-valued samples produces the 64-point FFT red dot positive-frequency spectral magnitude samples in the above right panel.
In my earlier 'Reply' I said we can't use a computer to compute the DTFT of a time sequence. So the above black curves are only an approximation of the input's DTFT magnitude curve. The black curves were generated by zero padding the 16-sample input out to 256 samples and computing a 256-point FFT, then connecting the first 128 of the FFT's magnitude samples with black lines and no dots. However, the black curves are a visually-accurate approximation of the continuous DTFT magnitude curve.
Hi. This whole spectral analysis topic has been and still is a fascinating topic. I enjoy reading other guys' interpretations of the subtleties of spectral analysis.

For me, whenever I got myself confused on this, I fall back on "calling one side of the transform time and the other frequency is just a convention (yeah, I mighty useful one...). We could just as easily call them the goat domain and the sheep domain and all the math still works whether we start with goats or sheep..." (ignoring the 1/N and "inverse" thing for the moment).
For the me, the way I think through the OP's original question is that lets start in the frequency domain and double the size of the data by adding zeroes at the end of the frequency domain data. Now do the (inverse, if we want to nit pick) transform; you end up with twice as many data points. I think we all agree that (time domain) will be all nice and smooth, just like Rick's picture in the frequency domain in his prior post.
And since it's arbitrary what we call our domains (time, frequency, sheep, goats...) the same concept of zero padding has to work starting with time domain.

Not me. We had enough terms already. Here is another case where terms cause confusion. LTE uses the word "time domain data" and "frequency domain data" quite frequently... A colleague was surprised to see frequency domain data is actually there under the nose (in effect in time domain). I explained that it is just a type of processing. It is not really two domains as such that one exists in time, the other in the mind. We are just using mixers plus accumulators to joggle around. How can I now relate to Sheep and Goat domains??
Thank you very much to everyone who has replied. I have been rather overwhelmed by the response. It may take me a while to fully comprehend all the replies, but in the mean-time, perhaps I could pose my question in a different manner:
Suppose I captured (or generated in Matlab) a sine wave over an exact number of cycles (or maybe one sample short) and performed a DFT/FFT I would get response in just one FFT bin (or two if you want to count negative frequencies as well).
Suppose then I wanted to interpolate the spectrum. I would zero pad the signal and then take an FFT. Then I would find energy in more than one bin. That's not right surely....
If it makes any difference, my background is recording and analysis of noise and vibration systems, so I deal with real signals and DFT/FFT.
Zero padding increases resolution (N) of FFT process at expense of bin shift(bin centers occur at Fs/N). It does not add any info or power to signal though causes a break (of your sine cycle). If this bin shift affects your results then don't zero pad. An alternative is resampling your signal to get higher N without bin shift
Hi MrColly. If you generated in Matlab an N-samaple sine wave sequence over exactly integer 'k' of cycles and performed an N-point DFT you would get a non-zero magnitude response in just one positive-frequency DFT bin as shown by the black dots in Figure 1 of the blog at:
https://www.dsprelated.com/showarticle/607.php
However MrColly, the true spectrum (discrete-time Fourier transform) of that N-sample, k-cycle, sequence is the continuous red curve in Figure 1 of the above blog. Now if you zero-padded the original N-sample sequence out to 2N samples and performed a 2N-pt DFT the magnitude samples' results would be the black dots in Figure 1 with an additional black dot in between each of the original dots.
And if you zero-padded the original N-sample sequence out to 4N samples
and performed a 4N-pt DFT the magnitude samples' results would be the
black dots in Figure 1 with three additional black dots in between each of the original dots (with all dots lying on the red curve).
When you generate an N-sample sine wave sequence in Matlab, make sure the last sample is equal to the negative of the second sample!
Hi Rick,
Thanks again for taking the time and effort to reply.
I would argue that the spectrum of a sine wave should be a Dirac delta function.
I think our differences arise because you used the Discrete Time Fourier Transform to generate the true spectrum.For the DTFT the wave sequence occurs just once, so you are not taking the spectrum of a pure sine wave.
I have assumed a DFT, for which the wave sequence repeats over and over again, so it is a (sampled) pure sine wave.
https://en.wikipedia.org/wiki/Discrete_Fourier_transform
Regards,
MrColly
Hi MrColly. You are most welcome. You wrote, "the spectrum of a sine wave should be a Dirac delta function."
That is theoretically true for a continuous (analog) sine wave that exists for all time. I use the word "theoretically" because (as far as I can tell) such an infinite-duration sine wave is an abstract mathematical idea and, like unicorns, does not exist in nature.
A finite-duration continuous (analog) sine wave, which we *CAN* generate in the laboratory or using the sound card in your computer, has a |sin(x)/x|-like spectral magnitude curve that you have seen in so many signal processing tutorials.
Hi, MrColly,
The spectral response of a sampled sine wave from which a finite-time sequence is taken (i.e., any practical sampled signal) is a dirichlet kernel. Many people, and I often do this, just say sinx/x, which is nearly right, there are just subtle differences.
If the sampling window has exactly an integer number of cycles in the window, then the only non-zero point of the Dirichlet kernel will be the center of the main lobe, which will duplicate your expectation of something that looks like the continuous-time response of a Dirac delta function.
Zero-padding the DFT/FFT just increases the number of samples of the same sinx/x, or Dirichlet kernel, to reveal more details of the main lobe and side lobes. This is essentially what the plots that Rick posted on the 26th are showing.
The sinx/x frequency response shape is the result of multiplying a continuous-time-domain sequence by a rectangular window in order to take a finite portion of it. The Dirichlet kernel is the same thing but for a sampled sequence, where the additional effects of the sampling are accounted for.
From this point of view there is no requirement that the input sequence be considered as repeating, since the multiplication by the finite rectangular window (which the padded zeros do not extend), fully explains the sinx/x response. Since the padding zeros are added outside of the original sampling window, the shape of the sinx/x is not affected, the main-lobe width does not change, but samples are added to the response.
I hope that helps a bit. There are a number of conceptual viewpoints that all work; assuming repetition, using the finite window, etc., etc., and when used properly all get to the same place with exactly the same results. Understanding multiple viewpoints can be useful, but if one clicks better for you, run with it. ;)


