


Increasing frequency of a sinusoids after FFT of a signal
 Started by 5 years ago●7 replies●latest reply 5 years ago●230 views
Hi everyone,
I am new to this forum.
I have a signal composite of 500Hz, 1700Hz and 2500Hz signal. Sampling rate is 48K and number of data is of 1 s that is 48K too.
I need to increase the 1700Hz frequency to 1700.50Hz without changing amplitude and phase.
How can I achieve this ?
Signal -> FFT -> [Process] -> IFFT -> Signal
What could be the Process to achieve the frequency?
Any help will be higly appreciated?

I have some of the same questions. Taking a stab at what you want, though...
I would probably window the data to reduce spreading and take a 192000 point fft. Then, I'd grab the +/- 20 bins surrounding the peak corresponding to the 1700Hz (centered at 6800) and shift the entire block two bins to the right. Then I'd grab the +/- 20 bins surrounding its mirrored counterpart (centered at 185200) and shift them two bins to the left. You'll have two redundant fft entries on each side leftover from your copy, but they are 20 bins away from anything of interest. Then, take the inverse fft and the real part of the first 48000 complex values that get spit out may be what you are looking for.
You will want to check it first, though. :)
I have no idea of your tolerance to noise and discontinuities and asymmetry and... This is definitely treating the data roughly. But - depending upon what you can live with - that might do it.

If I didn't miss the point:
changing the frequency cannot leave the phase unchanged, because a higher frequency means the phase is changing faster, so you cannot have unchanged phase, or?

Can you tell us what problem you're trying to solve? Maybe a FFT/IFFT isn't the right approach.
(here comes the 20 questions) If I understand it the data is 1 second long? What comes before and after? How do you synchronize your data capture to where the data you want to change is? If the tones are bursts then the "artifacts" from those transitions have to be considered. Is the amplitude constant? If not then the effects of the signal modulation would need to be considered.
I read it as you have 1700 cycles in and you want 1700.5 cycles out in the same time period; you don't mention noise but that's going to play in to any real system and maybe break it. How accurate is the source in the first place, are you trying to get a specific number out or change by a %?

Hello,
the idea of djmaguire is very good. For the frequency of 1700.5 HZ you have to increase the resolution of the FFT to 0.5 Hz / Bin, so you need a data block of 2 seconds with a length of 2 * 48000 values. In the FFT of your signals, you must remove the line of frequency 1700 Hz and insert an 'artificial' line for the frequency of 1700.5 Hz.
I give you a MATLAB script in which the artificial signal is generated from the artificial FFT for a given frequency (such as 1700.5 Hz).
% Script freq_change_1.m to change the Freq. 1700 Hz
% to Freq 1700,5 Hz
clear;
% -------- Initialisations
fs = 48000; % Sample Freq.
Ts = 1/fs;
N = 96000; % Datablock
t = 0:Ts:(N-1)*Ts;
f1 = 1700; % Beginning Freq.
f2 = 1700.5; % Freq. to be generated from FFT
ampl1 = 2.5; % Amplit.
phi = pi/3;
x1 = ampl1*cos(2*pi*f1*t + phi); % Signal of Freq. f1;
x2 = ampl1*cos(2*pi*f2*t + phi); % Signal of Freq. f2 for FFT test;
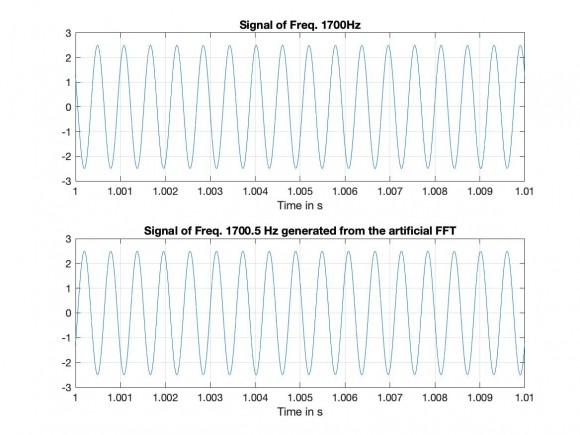
figure(1),
subplot(211), plot(t,x1);
La = axis; axis([1,1.01,La(3:4)]);
title(['Signal of Freq. ',num2str(f1),'Hz']);
xlabel('Time in s'); grid on;
subplot(212), plot(t,x2);
La = axis; axis([1,1.01,La(3:4)]);
title(['Signal of Freq. ',num2str(f2),'Hz']);
xlabel('Time in s'); grid on;
X1 = fft(x1)/N; % FFT of Signal with Freq. f1
X2 = fft(x2)/N; % FFT of Signal with Freq. f2
figure(2),
subplot(211), stem((0:N-1), abs(X1));
title('abs FFT of Signal x1');
xlabel('Bins of the FFT');
subplot(212), stem((0:N-1), abs(X2));
title('abs FFT of Signal x2');
xlabel('Bins of the FFT');
% ------- Generating the Signal of Freq. f2 from artificial FFT
delta_f = fs/N; % Resolution of the FFT
m10 = f1/delta_f, % MATLAB Indexes
m20 = N - m10,
% ------- The artificial FFT of the Signal with f2 Hz
X2 = zeros(1,N);
m1 = f2/delta_f, % Bin of the FFT (in the first Nyquist Intervall)
m2 = N-m1, % Bin of the FFT (in the second Nyquist Intervall)
X2(m1+1) = (ampl1/2)*exp(j*pi/3); % Artificial FFT
X2(m2+1) = (ampl1/2)*exp(-j*pi/3);
figure(3), stem((0:N-1), abs(X2));
title('The artificial FFT from which the Signal x2g is generated')
xlabel('Bins der FFT');
x2g = (ifft(X2))*N; % Generated Signal from the FFT
figure(4),
subplot(211), plot(t,x1);
La = axis; axis([1,1.01,La(3:4)]);
title(['Signal of Freq. ',num2str(f1),'Hz']);
xlabel('Time in s'); grid on;
subplot(212), plot(t,x2);
La = axis; axis([1,1.01,La(3:4)]);
title(['Signal of Freq. ',num2str(f2),...
' Hz generated from the artificial FFT']);
xlabel('Time in s'); grid on;

You have tones from somewhere(signal?) but want to generate/regenerate tones at certain frequencies from fft/ifft. I am lost in the reasoning here, sorry.

Assuming you have the spectrum in complex form you band pass filter out the 1700 Hz, multiple the result by a .5 Hz complex sinusoid and add the result back into the output.


