


Hello,
I have some problems understanding the I/Q sampling concept. For example, let's take a look at the following system:
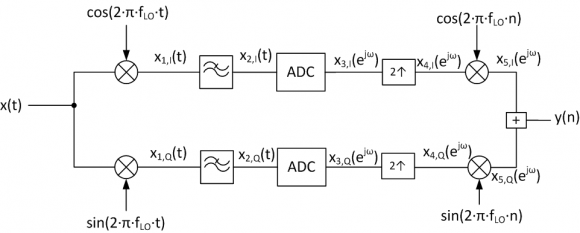
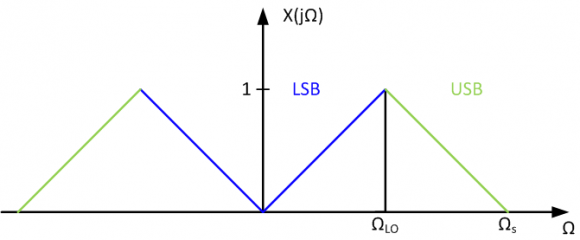
and an band-limited input signal (BW=2*fLO) with the following spectrum (divided into lower and upper sideband):
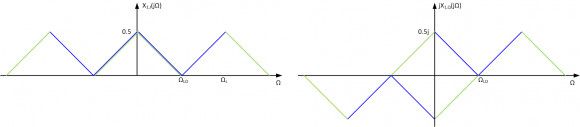
After the mixing process, we obtain the following spectra:
Using ideal low-pass filters with a bandwidth BW = fLO and sampling with a sample period 1/T = 2*fLO, results in infinite copies of the filtered signals shifted by 2*pi/T:
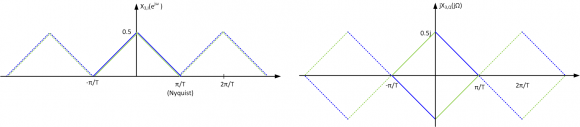
The upsampling operation increases the frequency-band of interest (-2pi/T...2pi/T), and "creates" images outside the region (-pi/T...pi/T):
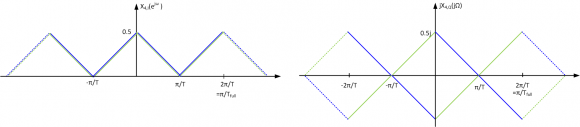
(for my understanding, the images are obtained just by considering the periodic extension of X3(jw) up to -2*pi/T ... 2*pi/T)
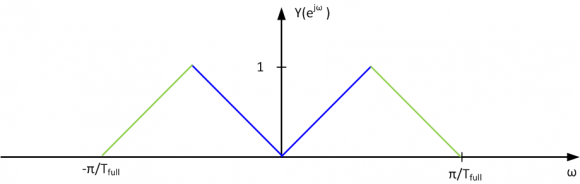
Next, multiplying the spectra in the digital domain to shift them back to their original position results in:
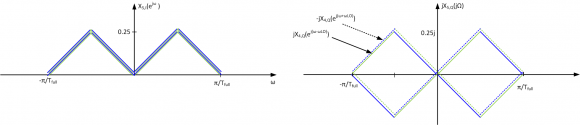
Taking a look at the RHS figure, all spectral components cancel out (which is obviously false!).
I think my problem lies in the upsampling operation. I know that all works out well when the images due to the upsampling are obtained by mirroring the negative part of the spectrum @ -pi/T, and the positive part @ +pi/T as shown below:
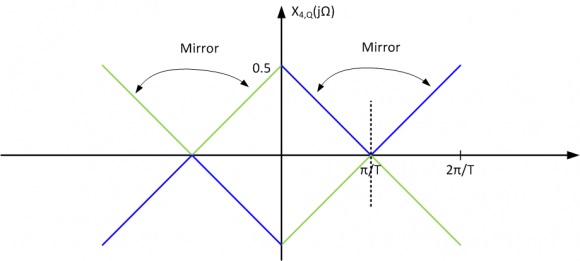
Is this correct?

Hello,
Looking at your diagram I assume you mean the incoming signal is mixed down to complex base-band. In that case then you sample the band limited signal where the Nyquist zone is over the range of -Fs/2 to +Fs/2. In that case your 1st figure is incorrect. Your input to output frequency is a line from below the axis (lower left quadrant) at (-Fs/2,-Fs/2) to above the axis (upper right quadrant) at (+Fs/2, Fs/2).
After sampling the next operation I see is an upsample by 2. This is essentially placing zeros in-between samples and up scaling by 2. The upsample raised the sampling rate (duh) and replicates the spectrum as an inverse image where the "fold" of the image is at the original Fs/2 and -Fs/2.
The next operation is a "rotator". This complex multiply will rotate the digital spectrum (up or down) about the unit circle in the Z plane. The amount of rotation is 2*pi*F0.
The final operation is a "mix" back to a purely real signal. In communications you typically want the spectrum to have a "clean" window in order to do this because you "lose" the negative portion of the spectrum. That is you are now only able to represent frequencies (0,Fs/2). Any positive and negative images that are the same distance from 0 will mix together. So you want the spectrum of interest to only exist as either a positive or negative image in the complex representation.
FWIW,
Mark Napier
Hi Mark,
Could you please elaborate just a smidge more about the final operation - mixing back to a purely real signal? We are talking about the addition operation where the real/imag signals are combined as in the block diagram at the top, right
How specifically would one ensure that the spectrum of interest is either a positive or negative image? I must be misunderstanding how this works because I can't see how this is done here.
Yes, that mix is usually the real part minus the imaginary part, y(n) = real(x(n)) - imag(x(n)).
The point is that both sides of the spectrum (+ and -) will add together. So whatever your spectral plan is there has to be a clear area one side or it will trash the other. The usual case is in baseband modulation. A complex baseband signal is constructed and then upsampled and filtered (half-band filters come to mind). Then the rotator is used to shift the baseband signal up in frequency. If you look at a spectrum of it there is just a positive image, no negative image. So then you mix the two components together and you get a real signal suitable for output to a DAC for an IF, for instance.
Here, yes, the diagram is incomplete. There is no filtering after the upsampling so there are spectral images in the upper halves. Also, there just isn't enough information about the signals to infer much else.
Excellent, thank you for a most complete reply Mark!
Hi,
thanks for your inputs...
@ napierm: I don't think Fig. 1 (I think you mean actually Fig. 2) is incorrect, sinde I don't want to show the input-output-frequency transfer characteristic, but the spectrum of a real signal (therefore symmetrical around DC) with a total bandwidth of Omega_s. My frequency range of interest is DC-Omega_s(=fs), so negative images are not my concern...
The basic idea of this example is the following: according to Nyquist, a sample rate twice the bandwidth of the signal is required to reconstruct the signal. In my example, I'm using two parallel paths, each sampled with half of the required sample rate.
You said that upsampling "replicates the spectrum as an inverse image where the "fold" of the image is at the original Fs/2 and -Fs/2." Isn't that exactly the answer to my question (respectively my last figure?)
As I said, using the last figure as upsampled spectrum of the Q-channel, you obtain the following spectra after the (digital) upmixing:
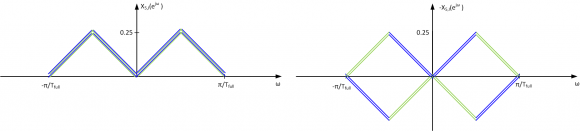
Please remark that I plotted -X5,Q, so you need to multiply with -1 before adding to X5,I. Therefore, after the addition, you get
@ Code_Warrior: The images you need to care about in my example are the USB and LSB, which are images (wrt the mixing operation). The image cancellation is done by using quadrature signals (i.e. as in a zero-IF-RX)...
Dont you need to have some kind of 90 degree delay (hilbert transformer) in one of I or Q - and then use inphase last mixer. ?
Joakim

Joakim,
Mixing the incoming signal with a cosine in the I path and with sine in the Q path provides the 90 degree delay.
Greg
Your issue is two fold. First, you have chosen your f0 as the nyquist frequency at the lower sample rate. Second, you are not filtering out your images after the upsampling. The result is that the images will cancel. If you want to prove it to yourself, calculate a sine wave at the nyquist frequency


