


Estimating SNR in the Frequency Domain
Dear All,
I am trying to estimate the SNR from the signal spectrum. I have implemented the algorithm presented in "Under standing digital signal processing" by R. Lyons which is given in Appendix D.
I follow the book steps but I don't get what I expected. I am comparing the results to the time domain extracted SNR.
My main problem is that when I change the frequency of the sinusoidal signal (fo) the computed SNR varies despite that I didn't change any FFT parameters.
The other issue, when I change the number of FFT bins (NFFT), the SNR value changes as well for the exact same sinsoidal signal.
I would appreciate your valuable advise.
##############################################################################
I have updated the file and it is working much way better now.
I included windowing, I normalized the FFT (as advised by MichaelRW), and I didn't divide the spectrum into positive and negative anymore. In addition to that I added DC extraction.
I did quick sweeps and it has a tolerance of +/-1dB.
This is the updated version:
##############################################################################
@27-Mar-2019
https://www.dsprelated.com/showarticle/1221.php?pw...this article on dsprelated which is addressing the same issue using the built in function "pwelch". I still have to go through it in more depth, but I wanted to share it with you before I go ahead.
https://www.dsprelated.com/showarticle/1221.php?pw...
Regards.

Hi,
I ran your code and found a couple of things I changed to generate a better frequency domain estimate of the SNR.
For the computation of the DFT, I divided the result of the ABS operation by the length of the signal (see the example in the Matlab documentation for the FFT operation). So,
sig_r_dft=abs(fft(sig_r, NFFT));
becomes
sig_r_dft=abs( fft( sig_r, NFFT) ) / length(sig_r);
This normalizes the operation for signals having different lengths.
I also changed the following line,
sig_r_spectrum = (sig_r_dft(1:NFFT/2)).^2;
to
sig_r_spectrum=( sig_r_dft(1:NFFT/2) ).*2;
taking half of the spectrum and doubling it to account for the other half of the spectrum.
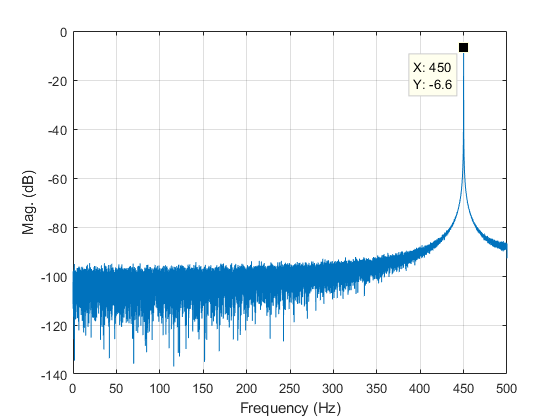
With these operations a plot of the positive-half of the spectrum (see figure below) properly shows an amplitude of 0.4677 (or -6.6 dB). This value is not 0.5 because the 450 Hz sinusoidal frequency does not fall into a single FFT frequency bin.
The second thing to look at is your selection of "peak" and "noise".
The peak of the spectrum is 0.4677 (with the above changes made to the code), but you select two magnitude values on either side of this peak, along with the peak, and add them, which increases your estimate of the "peak" value (from 0.4677 to 0.7571).
You do a similar thing for the estimate of the noise, selecting regions below and above the peak in the spectrum. A better estimate of the noise can be realized by selecting a frequency region further away from the peak value where the spectrum is more horizontal. See the following figure.
From this figure, using values between 0 and 150 Hz would be appropriate. My estimate with these changes is 47.9 dB, which is closer to the theoretical value of 55.7 dB compared to your estimate of 34.9 dB. Given all the factors in play (i.e. FFT bin leakage, windowing, estimation of peak and noise, etc.) it's hard to have the estimate be equal to the theoretical value.
As indicated by the other respondents, windowing will influence the results.
I hope this helps.
Dear MichaelRW
Many thanks for your kind correspondence.
I have made the first change, but I replaced the denominator by NFFT, to be:
sig_r_dft = abs(fft(sig_r, NFFT)) / NFFT;
since the length(sig_r) is larger than the DFT number of bins.
I don't see any change in the second line, they are exactly identical.
I am not able to find the appropriate value for the "leak" around the peak index. But I also set it to 0, and that also didn't work.
Any proposals to improve the accuracy of the results? 5 dB discrepancy still a huge gap.
Regards.

Hi,
actually taking square values of the spectrum (sig_r_spectrum = (sig_r_dft(1:NFFT/2)).^2) is needed for finding powers, and multiplication by two is for one-sided spectrum.

I didn't see anything in my copy of Rick's book in App D about this, but usually in the frequency domain SNR estimation is done assuming constant noise spectral density in the region of the signal. Estimate the noise spectral density (probably from noise density adjacent to the signal spectrum) as Pn/BWe (where BWe is the estimation bandwidth), then estimate (Ps+Pn)/BWe from the region of the signal. This allows estimation of (S+N)/N which can then be converted to SNR.
If the signal is a sinusoid and you're using a DFT for the spectrum analysis, there will be potentially 3dB variation in the signal power estimation due to scalloping losses, depending on what window function you're using. If you use something like a flat-top window (which is not the same as a rectangular window), then that scalloping can be essentially eliminated, but otherwise it is a concern with most common window functions.
Scalloping losses are frequency dependent, e.g., with a rectangular window the frequency domain peak of a sinusoid halfway between bins will be down 3dB from the same power sinusoid centered in a bin.
Dear Slartibartfast,
Many thanks for your reply.
I have the 3rd edition of the book and the Appendix is about statistics.
I have tried with and without windowing, that didn't make much different in the estimation.
I would give it a try with a predefined BW and check if that would make a different. However, I am not sure if that explains why the value varies with the variation of the sinusoidal frequency.
Keep you posted.
Regards.
Does your signal exactly fall on bin?
Not a must, so I intentionally choose some frequencies which are not exactly located at a f_bin.
I didn't say it is a must. If you choose your signal on bin, finding SNR is straightforward.
It will get the correct SNR if it aligned with a f_bin, however, I am seeking a generic function which I can rely on on my simulations. At least, that's the goal.

Hi ahmedshahein.
I'll run your 'statistics_32695.m' file and see if I can be of any help to you.
Thanks a lot. Can’t wait for your remarks. Regards
OK, I'm back on duty. (It's early Saturday morning.)
I experimented with your original 'statistics_32695.m' code. I see that you've updated your original post so I took a quick look at your updated 'statistics_72838.m' code.
The secret to your recent success is that your new 'leak' value in the updated code is much larger than the 'leak' value in your original code.
(I haven't experimented with it but I think your 'leak' value should be set to two different values in the two different cases of "windowed input signal" and "non-windowed input signal.")
In my experimentation I noticed that the best 'leak' value depended on the SNR of the input signal.
Did you notice that your method of selecting which DFT power samples to use in computing "signal-only spectral power" is different than the method I suggest in Appendix D of my book's 3rd Edition? The two methods should give rather similar results but I just wanted to point out that methodological difference to you.
By the way, with your 'n = 2^16' you're analyzing over 29,000 cycles of your input sine wave. You can reduce that 'n' value to n = 2^9 to sufficiently model this "estimate SNR from DFT samples" process.
In your post's updated text you wrote, "I did quick sweeps and it has a tolerance of +/-1dB." I'm not sure what a "sweep" is but I collected 20 blocks of input samples (all with different noise contamination), performed 20 SNR computations (20 SNR estimations), and plotted those 20 SNR values. Doing that shows the variability (the fluctuating results) of making signal measurements on noisy signals.
One last thing: the method I suggest in Appendix D of my book's 3rd Edition to estimate SNR from DFT power samples only applies to narrowband input signals. (That is, input signals whose bandwidths are very small relative to the Fs input data sample rate in Hz.)
ahmedshahein, because you have a copy of my DSP boo, have you had a look at:
Dear Rick,
I am sorry for my delay in reply, my laptop crashed and I had to reinstall everything from scratch.
Anyway, regarding "DFT power samples to use in computing "signal-only spectral power" is different than the method I suggest in Appendix D of my book's 3rd Edition". That's due to the fact that there was specific formula on how to set the threshold. Therefore, I chose this criterion but please if you have any insights I would appreciate your feedback on how to set it properly.
Thanks a lot for the errate file.
You got "sweep" exactly what I mean it to be. So I added a loop to change the fo, and NFFT. Afterwards I compared the outcome to the theoretical values.
So, how do you think about it now, can I rely on it?
Regards.
Ahmed.
A reply to ahmedshahein's 3/27/2019 message:
Hi ahmedshahein. Three things:
[1] As kaz said on 3/22/2019, "This issue is complicated." What I have learned is: When the signal's frequency is not at a DFT bin center and no windowing is used, the threshold value to be used in my Appendix D method depends on (1) the number, N, of samples in the DFT and (2) the signal's true SNR.
When the true SNR is 10 dB a rough (approximate) threshold value when N = 256 is Thresh = 0.0075 times the signal's maximum spectral power (magnitude squared) sample. When N = 512, and the true SNR is 10 dB you might try setting the threshold to Thresh = 0.0025 times the signal's maximum spectral sample. When N = 512, and the true SNR is 30 dB you might try setting the threshold to Thresh = 0.00005 times the signal's maximum spectral sample. But please don't take my numbers too seriously. DO NOT TRUST ME. You must experiment and experiment. And then experiment some more.
[2] Again, the method I suggest in Appendix D of my book's 3rd Edition to estimate SNR from DFT power samples only applies to narrowband input signals. (That is, input signals whose bandwidths are very small relative to the Fs input data sample rate in Hz.) My Appendix D method ignores the noise spectral components that lie within the narrow frequency range of the signal of interest. For wideband signals my Appendix D method is NOT the best way to estimate SNR.
[3] Keep in mind: When you perform multiple measurements of some parameter of a noisy signal, each time you make a measurement you will obtain a different value. That is why people perform multiple measurements of some signal parameter and compute an average of those measured values.
Hi,
Your updated version seems to calculate SNRs, I tried different f0 values. What was particular combination of parameters?

Hi,
This issue is complicated. Firstly studying a single tone case is well established within ADC/DAC industry as they use it to measure performance of their devices with respect to quantisation noise. You seem to be repeating their work but for noise in general and in a simple coding approach. It may not help if your signal is actually bandlimited rather than clean tone apart from self intuition.
The quantisation noise has this famous equation: snr(due to Quantisation with full scale tone) = 6.02n +1.76 where n is bitwidth.
if not full scale you can scale down n accordingly.
In matlab that bitwidth can be 64 bits (FP).
You can use this as benchmark for checking your code.
For bandlimited signal: SNR(Q) = 6.02 + 4.77 + dBFS
where dBFS = 10log(mean power/Full scale power)
The single tone case becomes subset as dBFS = 20log(0.707) = - 3.01
secondly spectrum noise floor is what you can get in frequency domain. Noise floor is not same as SNR but can give a clue. This is because some noise is inband and some out of band. Measuring noise floor versus top of spectrum is subjective and gives rise to errors.
As mentioned by many replies here: signal bandwidth, fft resolution, window type, averaging, upsampling/oversampling, flatness of spectrum inband and outband,... all interact.
It will help to know what is your specific goal in this study.
Kaz
Dear Kaz,
Many thanks for your reply.
I totally agree with you that the SNR is not the noise floor. However, I think we can deduce the SNR including quantization noise with the same concept given in by script.
Let's assume that the noise floor is dominated by quantization noise. In this case the SNR would match the theoretical formula which you gave in your reply. We can test that by updating the script as follow:
Ar = 0.000001;
sig_r = round( 2^Q * sig)./2^Q; % This is a very basic quantization
If you ran the script you will observe a match in the estimated SNR_dB and the 6.02xQ + 1.76. If you plotted the output spectrum you will see that the value estimated can't be deduced from the figure, e.g., I got SNT_dB of 74 but the noise floor seems to be at -62 dB.
I wanted to have this simple script to test NCO output.
I didn't understand "Full scale power", could you please elaborate on that topic.
Regards.
Hi,
full scale power for 16 bits signed as an example is square of 2^15 and is just reference point to measure signal power dynamic range for fixed point.
If you are after NCO then you got a simple case. Do not do any windowing. select number of samples that make your tone have exact cycles without any break. do fft and check. You should get a single line in one bin only
The other bins will have some value if floating point(tool dependent). If you round it then these bins become zero and you will have to tweak it to get log of zero i.e. add some very small value by hand.
As such the single tone case have one variable left, that of fft resolution.
if you change resolution but still have complete cycles (without any zeroing) then noise will stay zero and tone will stay unchanged i.e. no spreading occurs.
If however you don't have complete cycles then you get all bins and specially adjacent bins stealing power from main line. this means now your main signal is still holding up despite the theft but some fake noise floor popped in. fft resolution change will then have more effect on noise bins spreading than on single tone.
zeroing of fft will break the cycles and lead to spread or bin shift.
notice that changing frequency may change this rule of full cycles per each fft length and you have to put it right.
so in short for NCO testing select complete cycles per any fft and you will get a nice clean single line with zero in other bins. You can now study the dB of tone easily.
Of course you might ask how come I expect quantisation noise yet noise bins are all zero? you got noise floor to tell. that is how it works...I believe.
keep it floating and you see these bins are not zero and dB is set as reference in the computation.
Dear Kaz,
Thank you very much for the clarification, sorry for my delay in reply. I had an issue with my notebook and I didn't have internet access. Anyway ...
This is an excellent suggestion to try out, zeroing the FFT. I will give it a shot and keep you posted.
Regards.


