


minimum phase HRTF reconstruction
 Started by 5 years ago●4 replies●latest reply 5 years ago●545 views
Hi,
I'm working on project about the HRTF manipulation.
I need to overwite the ITD of an existing HRTF dataset in the frequency domain by minimum phase plus delay reconstruction. This method consists in estimating the delay to be applied, convert this delay to phase and add it to the minimum phase of the data. The estimated ITD can be used as a time-constant delay t_itd. However, because the delay of the minimum phase t_mp is not zero, t_itd must be compensated:
t_itd = ITD − t_mp
You can check this on page 14 of the paper of the following link
https://projekter.aau.dk/projekter/files/291096949/Jason_Tissieres_SMC_2018.pdf
My idea was based on:
1) estimate the ITD and the delay t_mp
2) convert on minimum phase (using cepstrum or Hilbert)
3) add the delay to the minimum phase of the data
My problem is how I can calculate the delay t_mp and which method I have to used to calculate the minimum phase. Obviously I'm working with Matlab.
Any idea is very welcome!

Hi guzpomi.
What are Earth do the acronyms "HRTF" and "ITD" mean?

Hey Rick,
I know HRTF stands for "Head-Related Transfer Function". It is basically the transfer function of the ear as a function of the sound source's azimuth in the plane of the head. It is one of the reasons we can still perceive direction of sound even if we cover one ear, i.e., direction is not determined solely by interaural time delays.
And this brings up ITD - "Interaural Time Delay" - this I had to look up; it is in the (rather nice) paper he referenced.
--Randy

Hey there,
I haven't really delved into the abyss of HRTF-related 3D audio, so I am not sure I can be of too much help but I'll do my best to work it out with you.
Regarding the minimum phase (I assume you refer to that when you say the delay), I am not sure this would be a valid way to do it but, have you tried to calculate the phase delay in the "traditional" way (link)?
If I find some time I will give it a try and let your. If you get any results in the meantime let us all know :).
Best,
Achilles.
Hi there,
I try to calculate the minimum phase with cepstrum method using Matlab function "rceps" and after that I plot the phase of the signal.
Then I try to plot the minimum phase using the minimum phase functions from the log-magnitude functions but they are differents.
I would like to know which one is the correct method for applying the time delay (ITD) converted to phase.
I enclose the instructions found on the paper that referred the linked paper below
"The phase functions for a given left-right pair of HRTFs are modeled by computing the left and right minimum phase functions from the log-magnitude functions (Oppenheim and Schafer, 1975 ), and adding a pure delay to the left minimum phase function. The right minimum phase function is used without modification. To estimate the appropriate interaural delay, we compute the cross-correlation function (via an inverse Fourier transform of the cross spectrum of the measured left- and right-ear HRTFs) and determine the delay corresponding to the maximum in the crosscorrelation function. This time delay is converted to phase and added to the minimum phase function derived from the left HRTF."
After that I need to anti-transform the function to get thr IR.
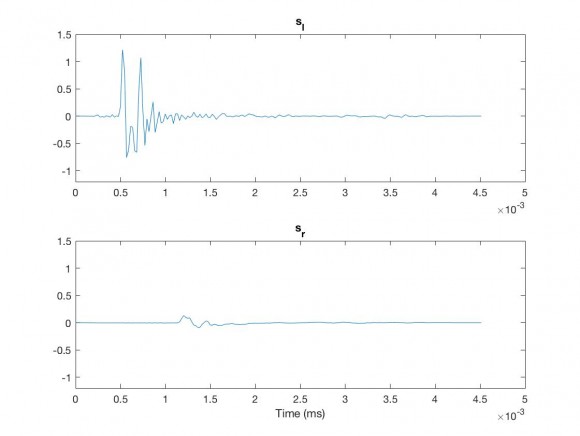
IR:
IR minimum phase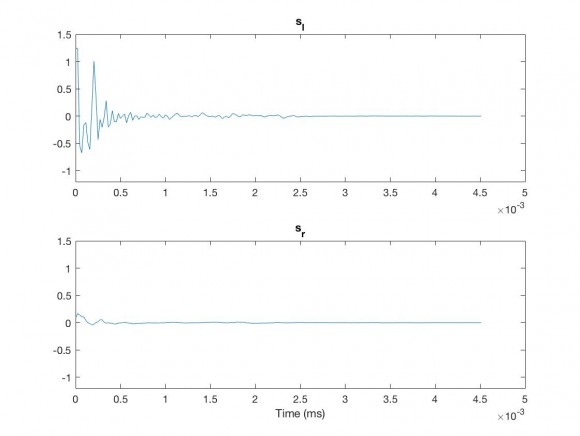
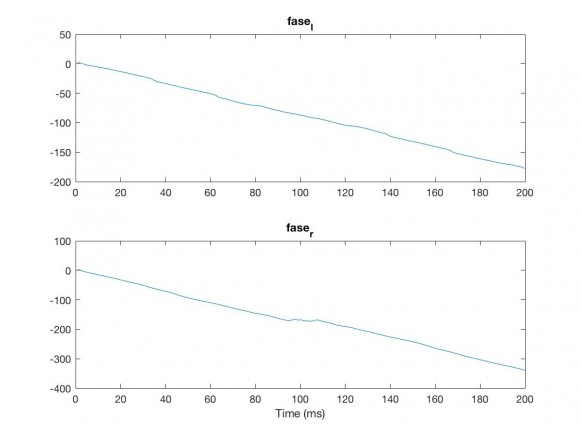
Cepstrum phase:
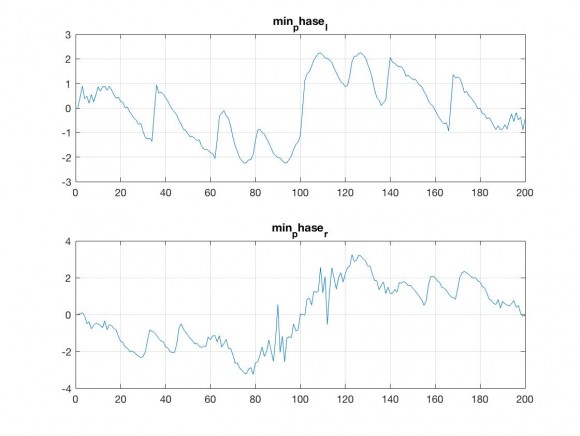
Log-Mag phase:
%Load HRIR file

cd subject_003;
hrir1 = load('hrir_final.mat');
cd ..;

Fs=44100;

%extract hrir(IR) subject_003 signal azimuth elevation 1 1
s_r = squeeze(hrir1.hrir_r(1, 1,:));
s_l = squeeze(hrir1.hrir_l(1, 1,:));


%sample time
t_r = (0:length(s_r)-1)/Fs;
t_l = (0:length(s_l)-1)/Fs;


figure
%plot hrir left
subplot(2,1,1);
plot(t_l,s_l);
ylim([-1.2 1.5]);
title('s_l');

%plot hrir right
subplot(2,1,2);
plot(t_r,s_r);
ylim([-1.2 1.5]);
title('s_r');
xlabel('Time (ms)');

% calculate the minimum phase with rceps
[y,ym] = rceps(s_r);
[x,xm] = rceps(s_l);

%plot HRIR minimum phase
figure
%plot hrir left
subplot(2,1,1);
plot(t_l,xm);
ylim([-1.2 1.5]);
title('s_l');

%plot hrir right
subplot(2,1,2);
plot(t_r,ym);
ylim([-1.2 1.5]);
title('s_r');
xlabel('Time (ms)');

% Calculate FFT and PHASE
fft_r = fft(s_r);
fft_l = fft(s_l);
phase_r = unwrap(angle(fft_r));
phase_l = unwrap(angle(fft_l));

%%%%%%%%%%%%%%%%%%%%% PHASE
figure
%plot hrir left
subplot(2,1,1);
plot(phase_l);
title('phase_l');

%plot hrir right
subplot(2,1,2);
plot(phase_r);
title('phase_r');

min_phase_r = unwrap(-imag(hilbert(log(abs(fft_r)))));
min_phase_l = unwrap(-imag(hilbert(log(abs(fft_l)))));

figure;
subplot(2,1,1)
plot(unwrap(min_phase_l));
grid on;
title('min_phase_l')

subplot(2,1,2)
plot(unwrap(min_phase_r));
grid on;
title('min_phase_r')

% HERE THERE WILL BE THE CODE TO ADD THE ITD (in phase) TO HRIR PHASE


% IFFT to return at HRIR(IR) signal


